Figures & data
Table 1. The RT-qPCR primers of Mus 5.8S, Mus TNF, Mus IL-6, Mus IL-1β, Mus COX-2, Mus iNOS and Gas-miR2-3p.
Table 2. Stem-loop primer of Gas-miR2-3p.
Figure 1. The relative quantity of Gas-miR2-3p in G. elata total RNAs, Gastrodia decoction, Gastrodia powder and different mouse tissues. Each mouse was fed with G. elata total RNAs, Gastrodia decoction, Gastrodia powder. The relative quantity of Gas-miR2-3p was detected by RT-qPCR (A) Gastrodia decoction, Gastrodia powder and G. elata total RNA; (B) spleen; (C) kidney; (D) cerebrum; (E) cerebellum; (F) hypothalamus; *p < 0.05; **p < 0.01; ***p < 0.001, compared to control group, n = 6.
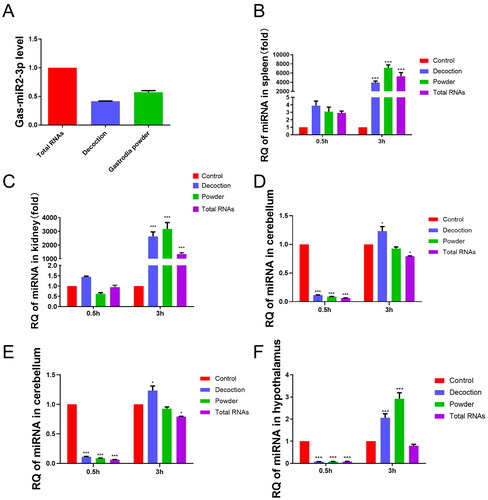
Figure 2. Effect of Gas-miR2-3p on mRNA levels of inflammatory factors in BV2 cells induced by LPS. The mRNA levels of TNF-α (A), IL-6 (B), IL-1β (C), COX-2 (D), iNOS (E). *p < 0.05; **p < 0.01; ***p < 0.001, vs NC, NC: negative control.
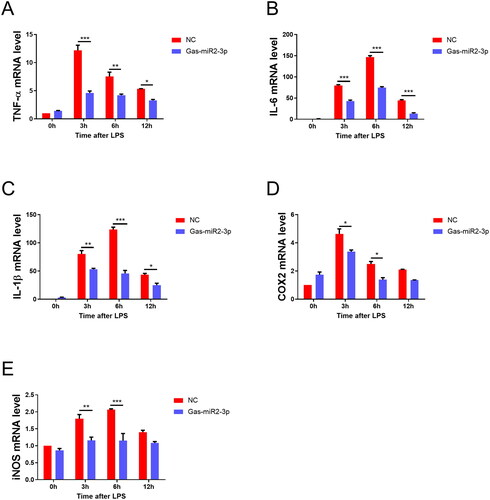
Figure 3. Effect of Gas-miR2-3p on inflammatory factors and NF-κB signaling pathway in LPS-induced BV2 cells. The levels of p65, p-p65 (A), and p-IκBα, IκBα (C) protein after LPS induction. The relative intensity of p65, p-p65 (B), and p-IκBα, IκBα (D) was normalized. The levels of TNF-α (E), IL-1β (F), and IL-6 (G) after 6 h induced by LPS in BV2 cell. *p < 0.05; **p < 0.01; ***p < 0.001, vs NC, NC: negative control.
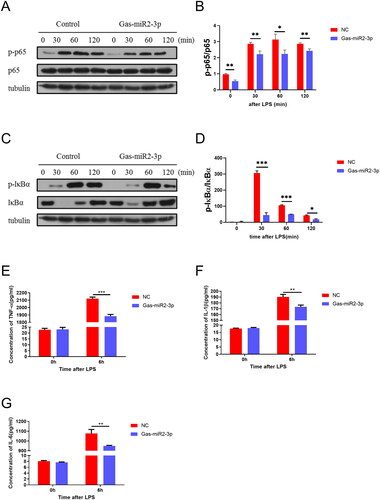
Figure 4. Determination of body weight of mice and effect of Gas-miR2-3p on mRNA levels of inflammatory factors in mice induced by LPS. (A) The weight of mice was detected daily. The mRNA levels of TNF-α (B), IL-6 (C), IL-1β (D), COX-2 (E), iNOS (F) in mouse brain. *p < 0.05; **p < 0.01; ***p < 0.001, vs NC, NC: negative control.
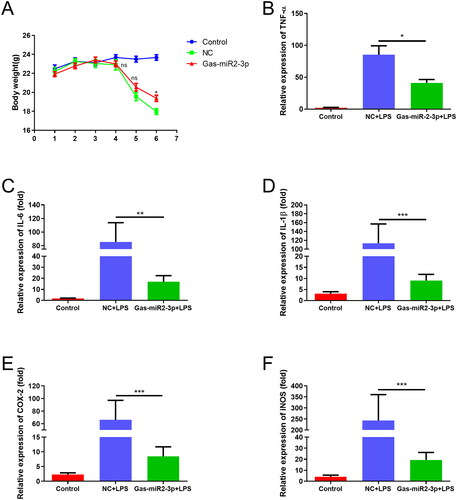
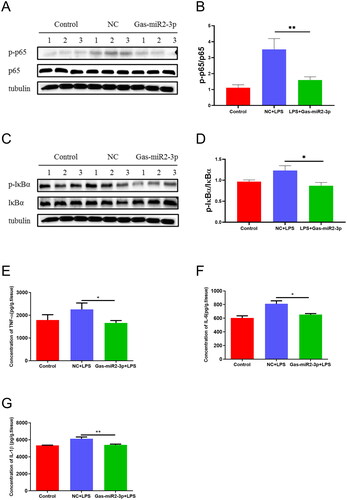
Figure 5. Effect of Gas-miR2-3p on inflammatory factors and NF-κB signaling pathway in LPS-induced mice. The levels of p65, p-p65 (A), and p-IκBα, IκBα (C) protein after LPS induction. The relative intensity of p65, p-p65 (B), and p-IκBα, IκBα (D) was normalized. The levels of TNF-α (E), IL-1β (F), and IL-6 (G) after 6 h induced by LPS in mice. *p < 0.05; **p < 0.01, vs NC, NC: negative control.