Figures & data
Figure 1. Flow chart.
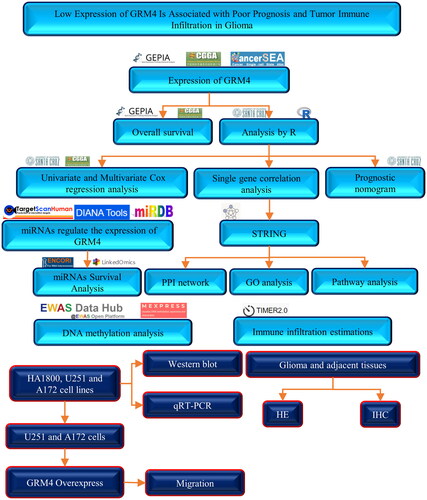
Table 1. Primer sequences.
Figure 2. The low expression of GRM4 in glioma is associated with prognosis. (A) According to the GEPIA database, the mRNA expression level of GRM4 in glioma tissues exhibited a statistically significant decrease compared to normal tissues. (B) Based on the data obtained from the CGGA database, the mRNA expression of GRM4 was found to be reduced in high-grade gliomas (C-D)GRM4 mRNA expression based on CancerSEA database GSE84465 and GSE57872 datasets. T-SNE is utilized to depict the cellular distribution, where each point corresponds to a distinct cell. The color of each point signifies the expression level of GRM4 within the respective cell. (E-F) expression of the GRM4 in the pertinent groups was evaluated through the utilization of qPCR and Western blot. All the data are shown as the mean ± SD (three independent experiments). Sig: ns p ≥ 0.05, * p < 0.05, ** p < 0.01, *** p < 0.001, **** p < 0.0001. (G) HE staining and IHC representative images of glioma and adjacent tissues. (H) Overall survival Kaplan-Meier analysis revealed that glioma patients with low GRM4 mRNA expression had a shorter OS than patients with high GRM4 levels.
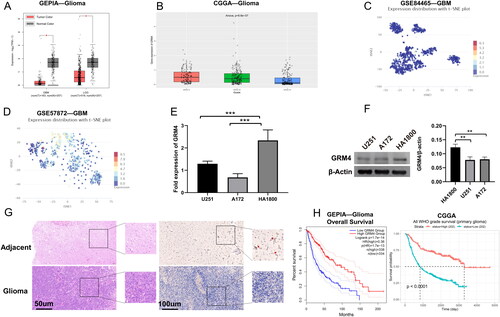
Figure 3. GRM4 In gliomas: prognostic, functional, and pathway enrichment analyses (A-B) univariate and multivariate analyses. HR, hazard ratio. (C) Overall survival predictions were based on the nomogram of the glioma cohort (TCGA-GBMLGG). (D) A network formed by the co-expression genes and GRM4. (E) Significant gene Ontology terms of GRM4, including biological processes, molecular function, and cellular components (BP, MF, CC). (F) GMR4 and other associated significant pathways.
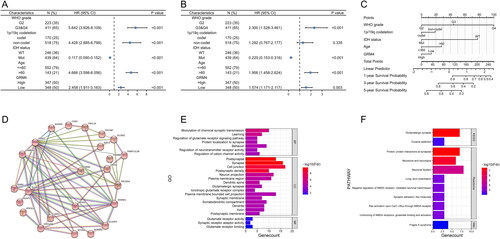
Figure 4. The role of miRNAs in the regulation of GRM4 in LGG (A) starBase was used to examine the correlation between the manifestation of predicted miRNAs and GRM4 in LGG. (B-L) The association between miRNA expression and prognosis in LGG.
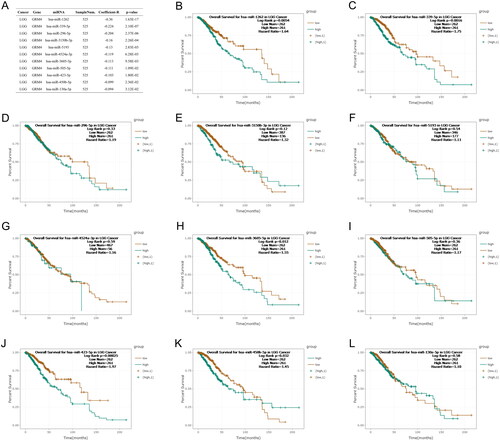
Figure 5. GRM4 methylation in glioma. (A, C) The methylation level of the GRM4 gene in glioma tissue exhibits a higher magnitude compared to that observed in normal tissue. (B, D) Patients exhibiting high levels of GRM4 methylation demonstrated a significantly inferior overall survival outcome in comparison to patients with low levels of GRM4 methylation.
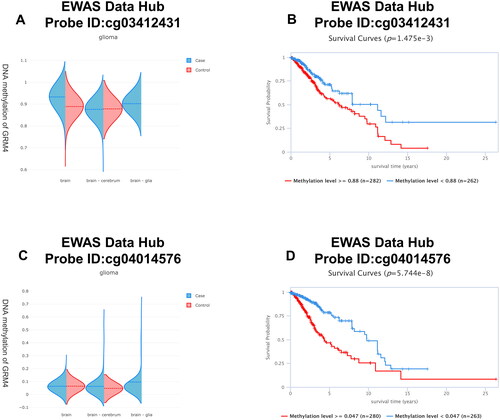
Figure 6. DNA methylation levels in the GRM4 gene are associated with the prognosis of GBM patients.
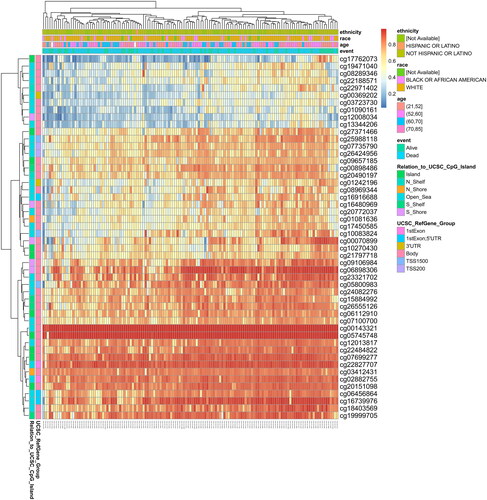
Table 2. Effects of methylation levels in the CpG sites of the GRM4 gene on the prognosis of GBM patients.
Figure 7. GRM4 overexpression inhibited GBM cell migration in vitro. (A) The expression of GRM4 in U251 and A172 glioma cells was detected through the utilization of qPCR and Western blot analysis after lentiviral transduction. (B) Wound healing assay images and statistical results, scale = 50 μm. (C)Transwell assay images and statistical results, scale = 50 μm.
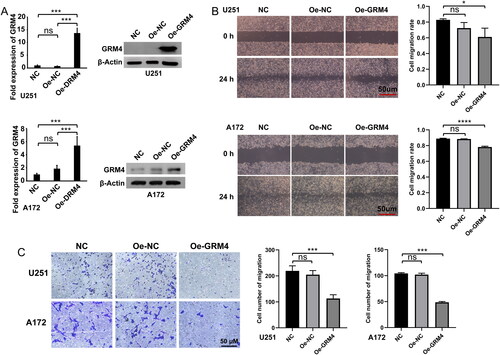
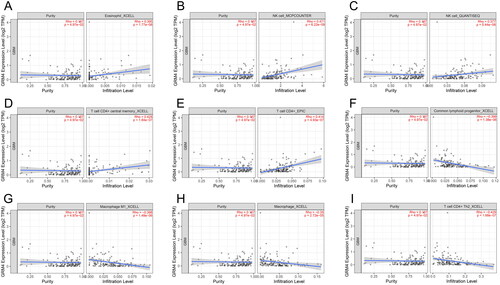
Figure 8. Immune cell infiltration and GRM4 expression are related. (A-I) GRM4 expression and immune cell invasion in GBM have a link to each other.