Figures & data
Table 1. Chemical composition of adhesive (Mass%) and mechanical property of adhesive bulk.
Table 2. Specifications of surface treatment (laser, blast and acid).
Figure 1. Schematic and dimensions of (a) DCB specimen, (b) LJ specimen, and (c) technique for controlling the adhesive thickness of Open Face specimen.
Figure 2. Procedure for accelerating deterioration of open-faced LJ/DCB.
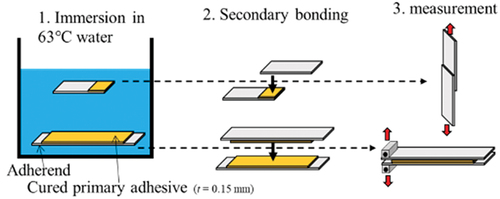
Figure 3. Weibull distribution of shear strength of undegraded Closed LJ.
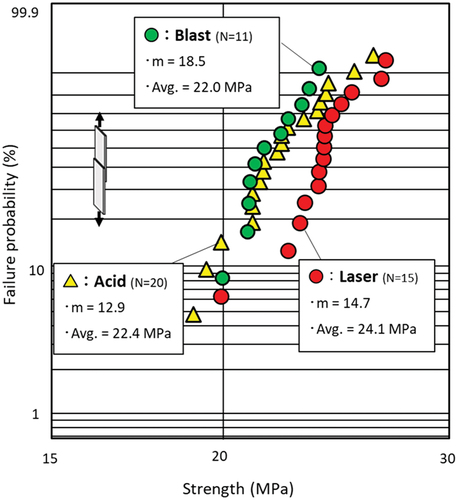
Figure 4. Accelerated deterioration test of Open LJ, which is (a) the relationship between immersion time at 63 °C and nominal shear strength. (b), (c), (d) Photograph of fracture surface of initial and degraded.
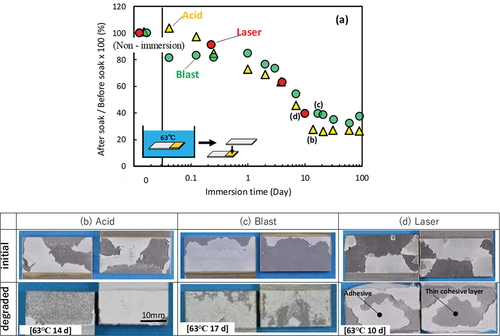
Figure 5. Accelerated deterioration test of Open DCB, (a) relationship between immersion time at 63°C and G1C, (b) strength and elongation of adhesive bulk specimen as a function of immersion time.
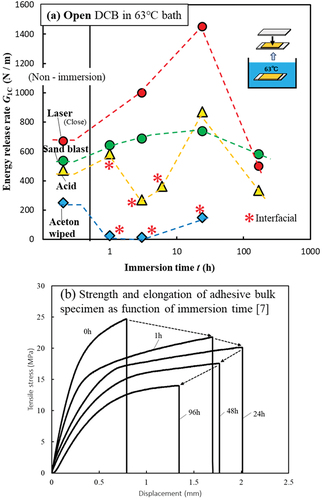
Figure 6. Photographs of fracture surfaces of Open DCB with four types of surface treatments before and after immersion. Upper and middle rows show the fracture surface photographs of the not-immersed specimen and the polarized micrograph of the thin-layer cohesive failure area, respectively. Bottom row shows the fracture surface photograph of specimens after immersion.
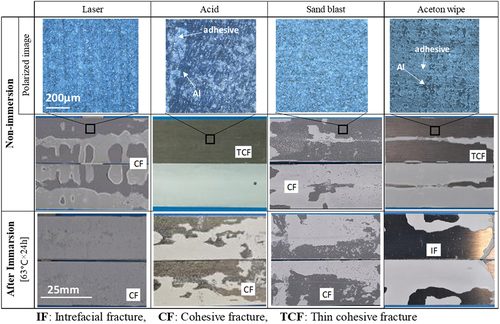
Figure 7. SEM images of adherend surface treated by (a) laser, (b) acid, (c) sandblast, and surface roughness and surface area ratio.
Figure 8. SEM images and EDS mapping of adhesive interface, which are fracture surfaces of non-immersed DCB specimen, (a) laser, (b) acid, and (c) sandblast.
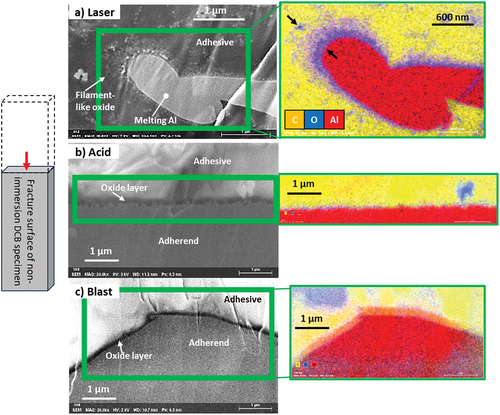
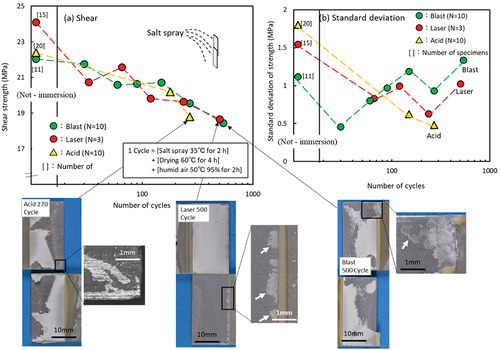
Figure 9. Results of salt spray cycle test, (a) relationship between salt spray cycle number and shear strength of Closed LJ, and fracture surfaces, (b) relationship between cycle number and standard deviation of strength.