
Figures & data
Figure 1. GP fluctuations in an aqueous solution of 2-pentanol (0.5 vol.%) at two Ug values.
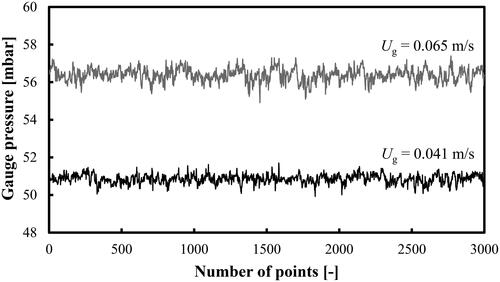
Table 1. Physicochemical properties of the various mixtures of DW and 2-pentanol.
Figure 2. NHI profiles as a function of Ug in a BC operated with a mixture of DW and 2-pentanol (0.5 vol.% and 1.0 vol.%) aerated with a compressed air.
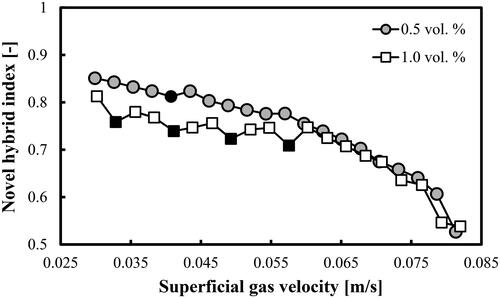
Figure 3. FR identification based on the information amount in a BC operated with a mixture of DW and 2-pentanol (0.5 vol.%) aerated with a compressed air.
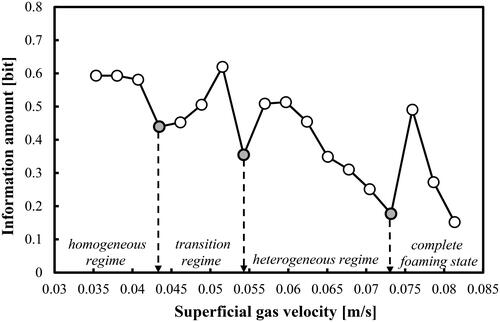
Figure 4. Gas holdup (based on a removal of the foaming layer height) profile as a function of Ug in a mixture of DW and 2-pentanol (0.5 vol.%) aerated with a compressed air.
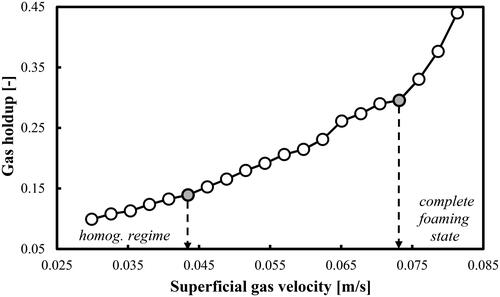
Figure 5. FR identification based on the information amount in a BC operated with a mixture of DW and 2-pentanol (1.0 vol.%) and aerated with a compressed air.
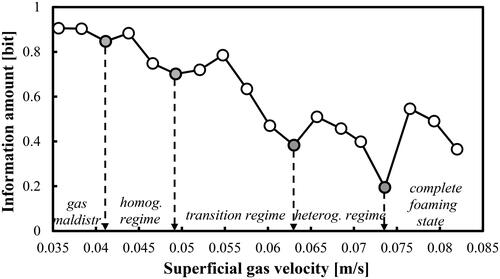
Figure 6. Illustration of: (a) the gas maldistribution (at Ug = 0.035 m/s) and (b) complete foaming state (at Ug = 0.076 m/s) in DW and 2-pentanol (1.0 vol.%) system aerated with air at ambient conditions.
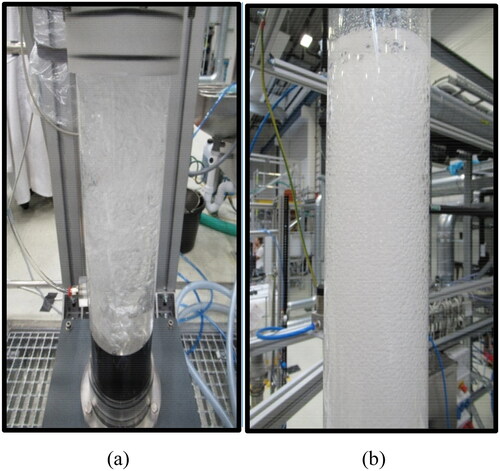
Figure 7. Gas holdup (based on a removal of the foaming layer height) profile as a function of Ug in a mixture of DW and 2-pentanol (1.0 vol.%) aerated with air.
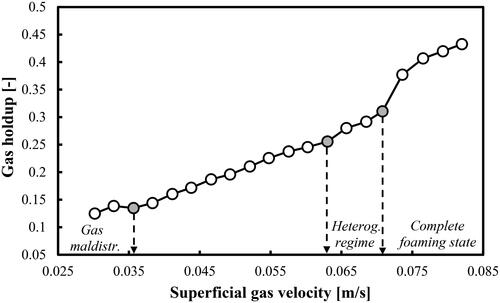
Figure 8. Prediction of overall gas holdups in a BC operated with a mixture of DW and 2-pentanol (0.5 vol.%) and aerated with a compressed air. Mean d value was fitted at 7.48 × 10⁻³ m.
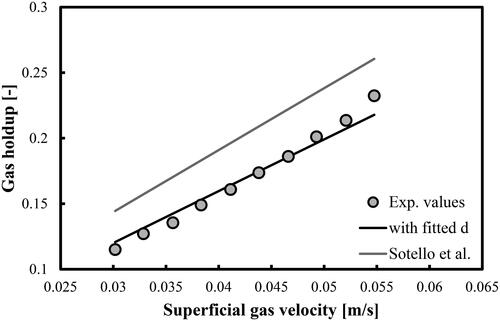
Figure 9. Prediction of overall gas holdups in a BC operated with a mixture of DW and 2-pentanol (1.0 vol.%) and aerated with a compressed air. Mean d value was fitted at 8.96 × 10⁻³ m.
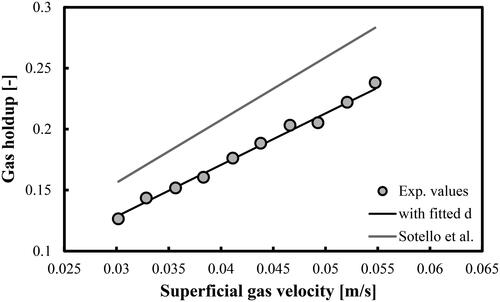
Figure 10. Prediction of overall gas holdups in a BC operated with a mixture of DW and 2-pentanol (1.5 vol.%) and aerated with a compressed air. Mean d value was fitted at 1.53 × 10⁻² m.
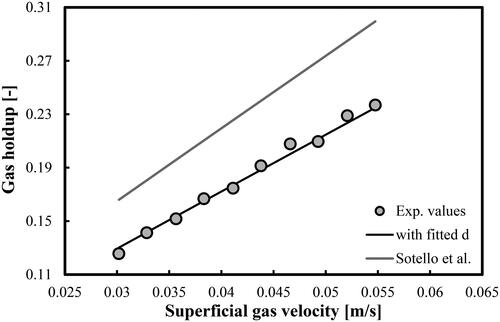
Figure 11. Prediction of overall gas holdups in a BC operated with a mixture of DW and 2-pentanol (2.0 vol.%) and aerated with a compressed air. Mean d value was fitted at 2.214 × 10⁻² m.
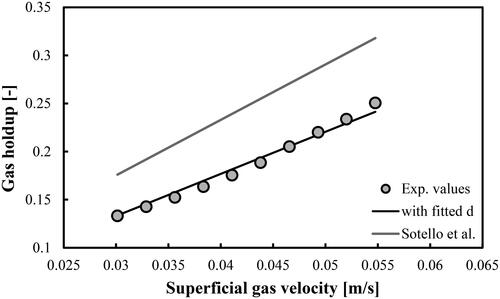
Table 2. Values of d and MRE for the various mixtures studied.
Figure 12. Variations of overall gas holdups as a function of Ug in a BC operated with different mixtures of DW and 2-pentanol and aerated with a compressed air.
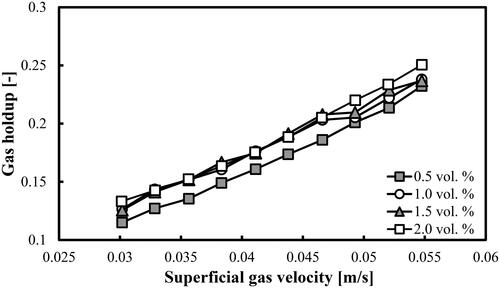
Table 3. Comparison of the errors among the different approaches.