
Figures & data
Figure 1. TiO2-Ag photocatalytic mechanism for the degradation of organic pollutants under visible light.
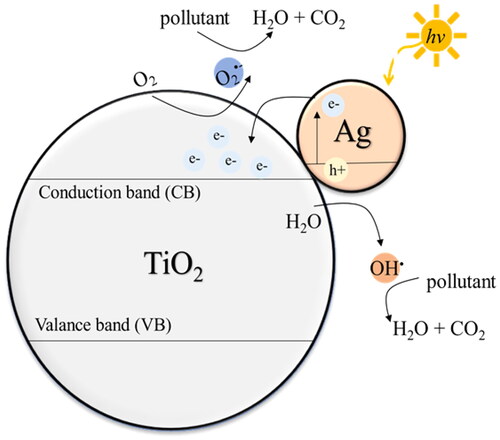
Figure 2. Schematic of plasma-enhanced chemical vapor deposition (PECVD) and physical vapor deposition (PVD) system experimental setup.
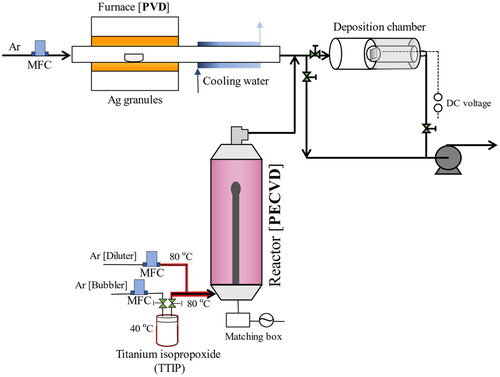
Figure 3. Scanning electron microscopy (SEM) image of a) pristine TiO2 and TiO2-Ag with b) 0.56 c) 2.97 wt% Ag content prepared by PECVD-PVD method and d) P25 film prepared by spin coating (a–c insets show the size distributions).
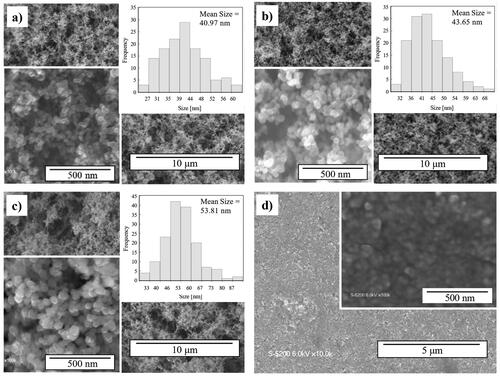
Figure 4. X-ray diffraction (XRD) pattern of nanoparticulate thin films prepared by PECVD-PVD an P25 film prepared by spin coating.
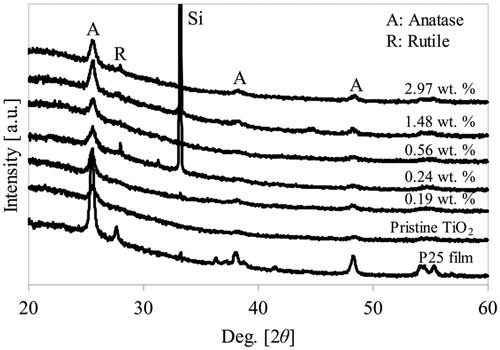
Figure 5. X-ray photoelectron spectroscopy (XPS) spectra of Ag 3d before and after annealing in N2.
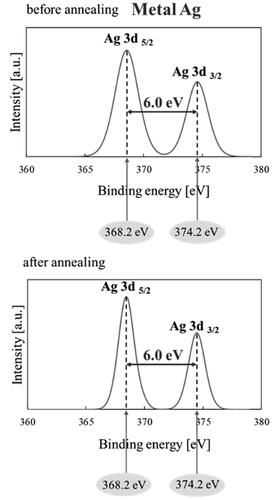
Figure 6. Absorbance spectra of the PECVD-PVD prepared nanoparticulate film and the P25 film prepared by spin coating.
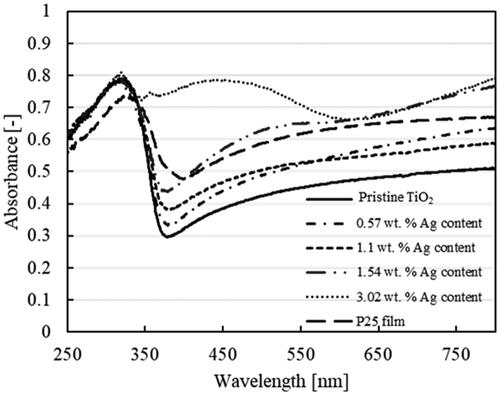
Figure 7. Absorbance versus wavelength as a function of time corresponding to the photocatalytic degradation of R6G by a) TiO2 and b) TiO2-Ag 0.24 wt%; comparison of c) percent degradation and d) reaction rate constant of the degradation processes.
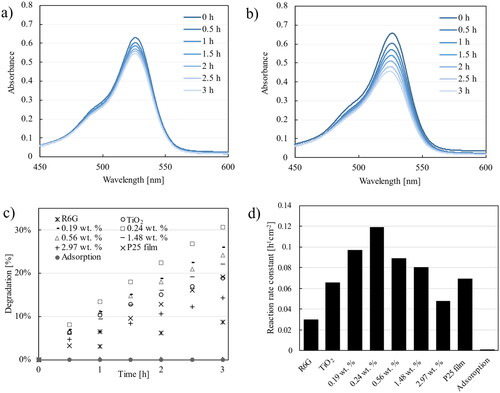
Table 1. Comparison of the photocatalytic activities reported in the present study and the literature.