Figures & data
Figure 1. Schematic diagram of experimental apparatus.
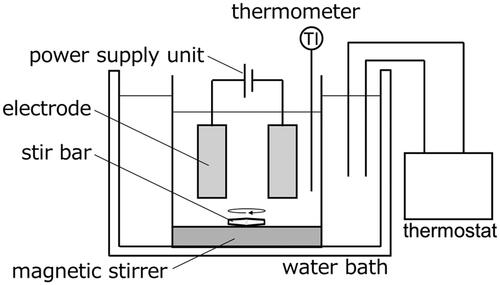
Figure 2. Chromatograph of hexane solution extracting liposoluble components in electrolysis with R-COONa (T = 20 °C, E = 20 V, Q = 1000 C).
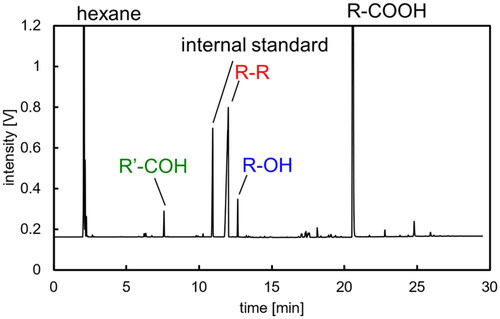
Figure 3. Reaction path ways of reported Kolbe electrolysis.
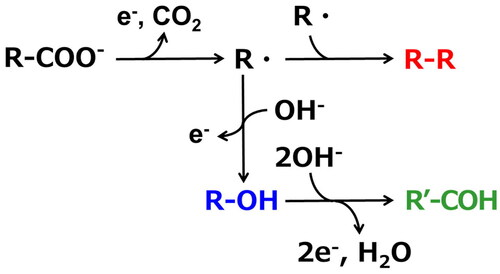
Figure 4. Conversion and yields of R-COOH and R-COONa in electrolysis (T = 20 °C, E = 20 V, Q = 1000 C).
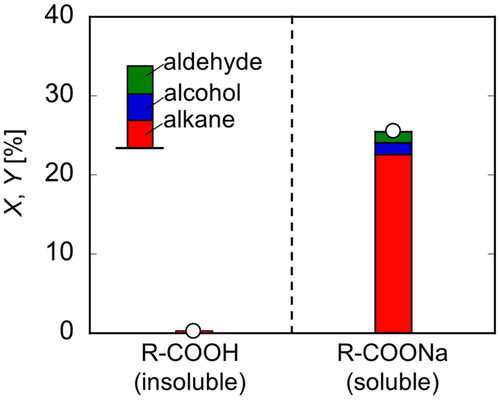
Figure 5. Concentration profiles of reactant and product and pH in electrolysis of R-COONa (T = 20 °C, E = 20 V).
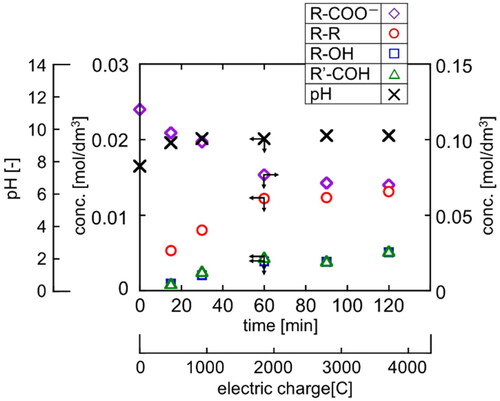
Figure 6. Profile of faradaic efficiency in electrolysis of e R-COONa (T = 20 °C and E = 20 V).
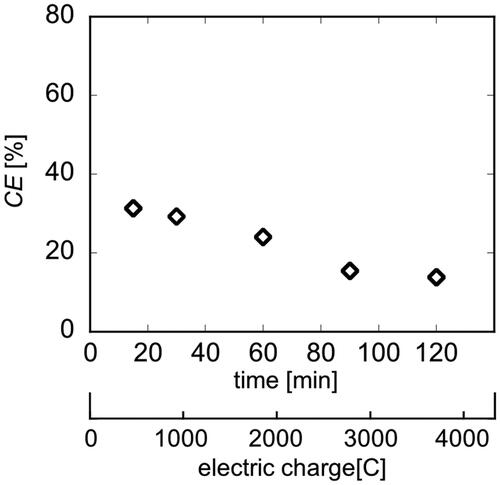
Figure 7. Conversion, yield and faradaic efficiency in electrolysis under various conditions at Q = 1000 C (Basic condition: T = 20 °C, E = 20 V, C = 0.12 mol/dm3).
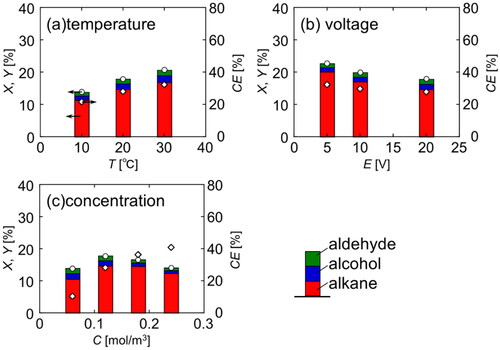
Figure 8. Schematic diagram of electrolysis mechanism on abode.
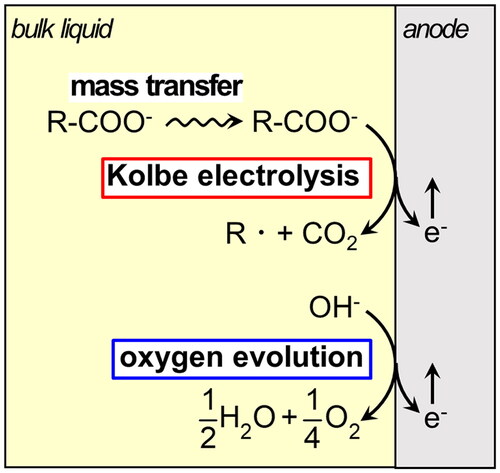
Figure 9. Photographs of reaction solution with C8 and C12 (T = 20 °C, E = 5 V, Q = 1000 C).
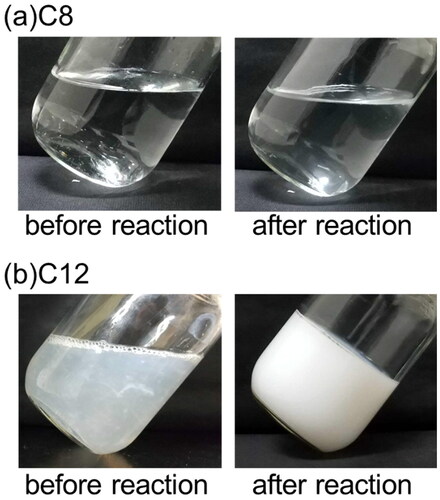
Figure 10. Conversion, yield and faradaic efficiency of various fatty acid salt in electrolysis (T = 50 °C, E = 5 V, Q = 1000 C).
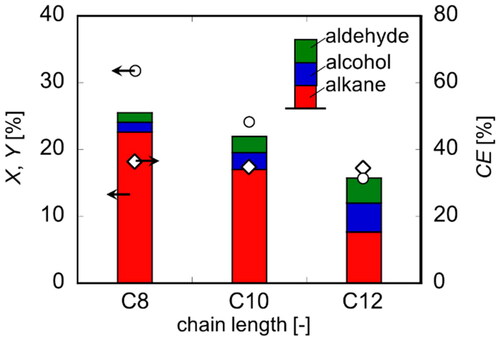
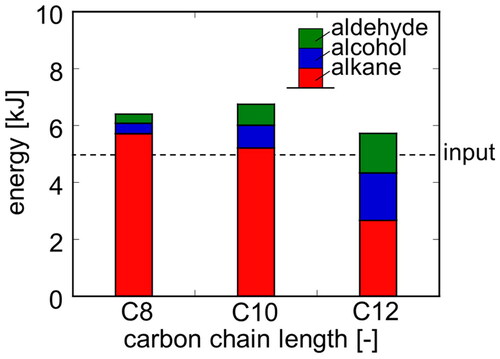
Figure 11. Generated energy value for various fatty acid salt (T = 50 °C, E = 5 V, Q = 1000 C).