Figures & data
Figure 1. On-centre steering control task. The driver steers the vehicle to follow a straight target path that has randomly changing lateral displacement . The driver must also reject random disturbances
,
and
acting on the steering-vehicle system. Angles are assumed to be small.
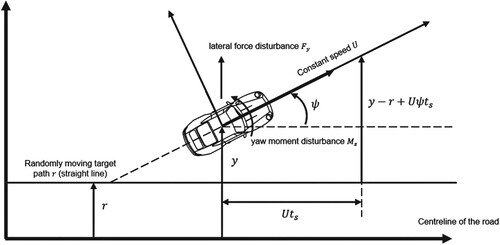
Figure 2. Block diagram of the linear driver-steering-vehicle model. The plant comprises the vehicle and steering system, including the driver's steering muscles. Plant disturbances are white noises ,
,
and
that are filtered in the plant. Plant outputs
are perturbed with measurement noise
. The plant is actuated by a muscle activation signal u, comprising cognitive LQR control
, reflex action
and process noise
. The Kalman filter receives an efference copy from the LQR. The Kalman filter generates estimates
of the plant states for use by the LQR.
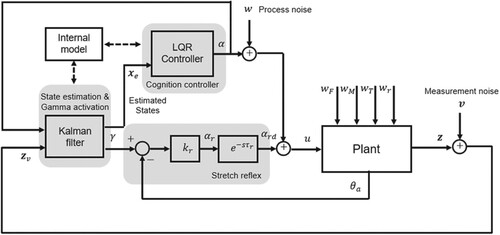
Figure 3. Block diagram of the plant, comprising muscle activation dynamics , muscle and steering dynamics
, vehicle dynamics
, human sensory measurement delays and plant disturbance filters
,
,
and
.
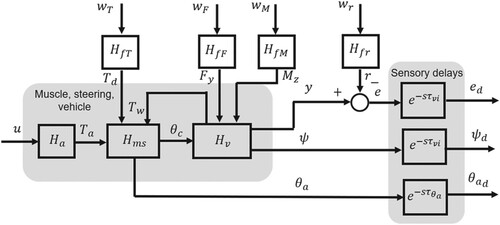
Figure 4. Muscle and steering system model with steering column torque disturbance. All springs and dampers act in torsion, aligned with the steering column axis.
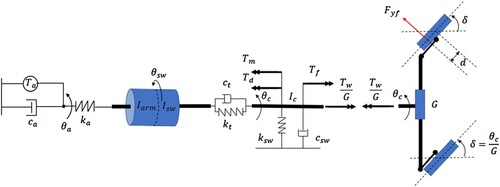
Figure 5. Driving simulator with test subject.
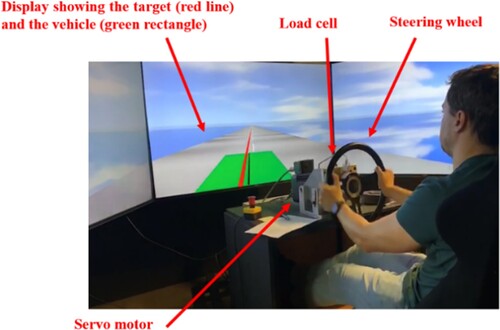
Table 1. Experimental conditions for each trail.
Table 2. Conditions for each step of the parametric identification procedure to find a single set of parameter values for each driver (or the averaged driver) across all three trials. indicates parameters to be identified at each step.
Figure 6. Agreement between simulated and measured handwheel angle, quantified as ‘variance accounted for’ (VAF). Blue crosses are for the Box-Jenkins model. Red triangles are VAFs achieved with a single set of parameter values identified for each driver across all three trials. Green circles are VAFs achieved with separate sets of parameter values identified for each driver/trial combination.
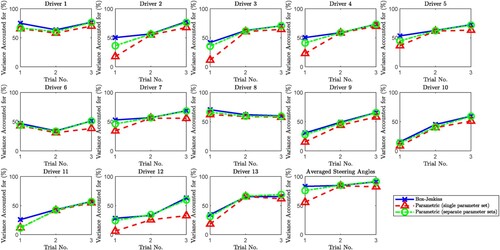
Figure 7. Identified single parameter sets fitting all three trials for the individual drivers (crosses) and the averaged data (solid horizontal lines). The average of the values of for the thirteen drivers, with the corresponding identified values of
,
and
for the averaged data are shown by the red dashed horizontal lines.
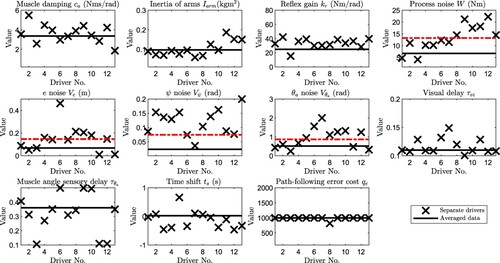
Figure 8. Investigation into signal-dependent driver noise. In (a), the identified process noise standard deviation W is compared with the RMS estimated muscle activation torque of the experiment. In (b), the SNRs for the individual drivers (crosses) are compared and the average SNR (solid horizontal line) over all the drivers is calculated. In (c), identified measurement noise standard deviations are compared with the corresponding RMS signal amplitudes for path-following error, heading angle, and muscle angle. Straight lines passing through the origin are plotted to assess the existence of a constant SNR.
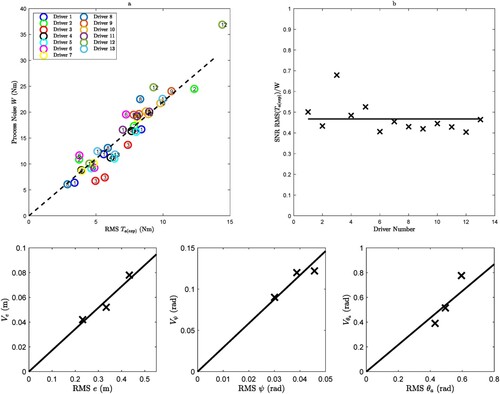
Figure 9. Identified single parameter sets fitting the linear trials 2 and 3 for the individual drivers (crosses) and the averaged data (solid horizontal lines). The average of the scaled values of over the thirteen drivers, with the corresponding identified values of
,
and
for the averaged data are shown by the red dashed horizontal lines.
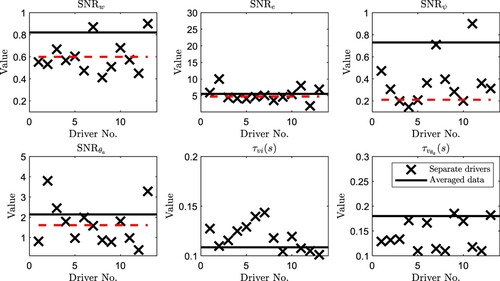
Table 3. Mean and standard deviation of the parameter values identified for the drivers across trials 2 and 3. Identified parameter values are compared with estimates from the published literature.
Figure 10. Validation of the parametric driver model with SNRs for each driver including the averaged driver (Driver 14). The VAFs obtained from the identification data are represented by the triangles on black solid lines for the Box-Jenkins model and the red crosses on red solid lines for the parametric model. The VAFs obtained from the validation data and the parametric model are represented by the black crosses on the dashed lines.
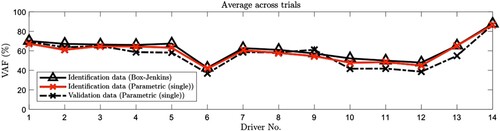
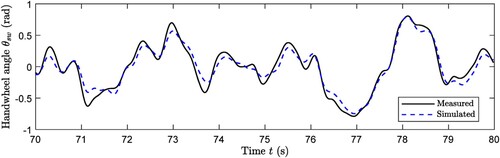
Figure 11. Typical time histories of handwheel angle for the averaged driver in trial 3, measured and simulated.