Figures & data
Figure 1. We utilise computational rationality to explain adaptive answering behaviour of a crowdworker: (1) The worker answers a task's questions negligently. (2) The task-giver introduces hidden gold-standard questions to detect negligent behaviour. This results in the worker being blocked from tasks. A scripted, always-cheating worker would continue answering negligently. (3) In contrast, our theory predicts that the worker adapts, stops cheating, and starts answering diligently. This replicates the effect found on real crowdsourcing platforms that cheating deterrents increase the quality of answers. Our theory explains this change in the worker's behaviour as the rational choice for the worker as it maximises long-term, expected subjective payoffs.
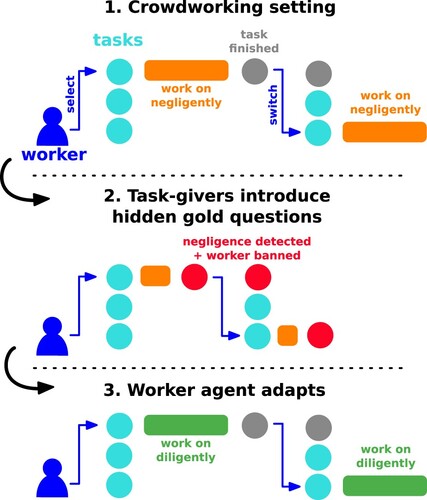
Figure 2. Screenshot of the homepage for workers of MTurk. Different task-givers (‘requesters’) list their tasks (‘HIT groups’). For each answered question (‘HIT’), the worker receives a small monetary reward visible in the list of tasks. A worker can decide which task to accept. Some tasks are blocked (lock icon) as the worker does not qualify for them.

Figure 3. Visualisation of the worker decisions. Left: the worker first needs to decide which task to work on. For some of the tasks' properties, such as their interestingness, the worker needs to try out the task to assess them. Right: once a task has been chosen, the worker needs to decide how much effort to put into answering each question.
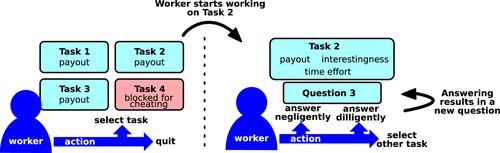
Figure 4. Visualisation of the reinforcement learning setup for modelling a worker as an agent in a crowdworking environment.
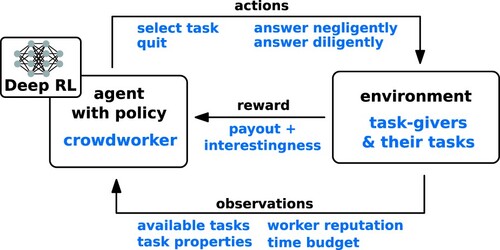
Figure 5. Higher payout increases task participation. An increase in mean payout results in the agent working more on these tasks. The mean payout of the target task-giver was shifted by setting the first parameter of the payout's beta-distribution from 10 to 15, 23.33, 40, and 90 resulting in mean payouts of 0.5 to 0.9. The parameter of the payout distribution for all other task-givers is kept unchanged by the default value 10 (plot visualises results for task-giver 2). The dotted line shows the theoretically expected participation if all task-givers were worked on identically. The grey bars show the empirical standard error over 1000 episodes. The model replicated human crowdworker behaviour, preferring to work on tasks with better payout (target) compared to competing tasks.
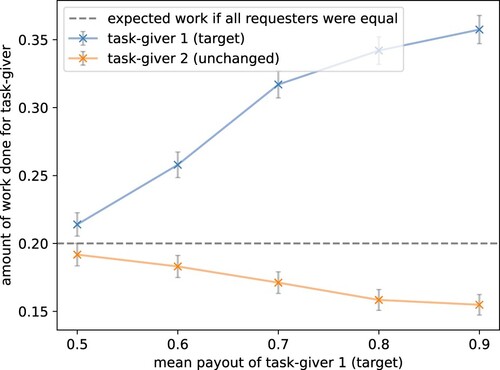
Figure 6. Higher effort decreases task participation. An increase in mean effort results in the agent working less on these tasks. The mean effort of the target task-giver was shifted by setting the first parameter of the time effort's beta-distribution from 10 to 15, 23.33, 40, and 90 resulting in mean time efforts of 0.5 to 0.9. The parameter of the effort distribution for all other task-givers is kept unchanged by the default value 10 (plot visualises results for task-giver 2). The dotted line shows the expected participation if all task-givers were worked on identically. The grey bars show the standard error over 1000 episodes. The model replicated human crowdworker behaviour, avoiding tasks that require more effort.
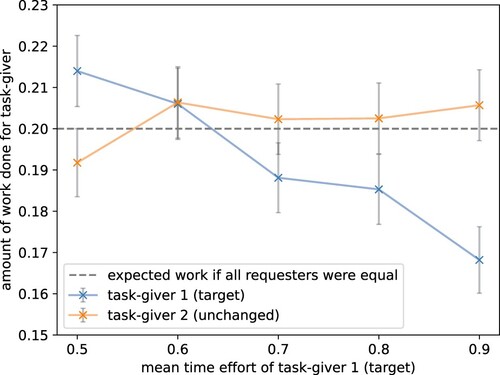
Figure 7. Higher interestingness increases task participation. An increase in mean interestingness results in the agent working more on these tasks. The mean interestingness of the target task-giver was shifted by setting the first parameter of the shifted interestingness' beta-distribution from 10 to 15, 23.33, 40, and 90 resulting in mean interestingness rewards (or enjoyment) of 0 to 0.4. The parameter of the interestingness distribution for all other task-givers is kept unchanged by the default value 10 (plot visualises results for task-giver 2). The dotted line shows the theoretically expected participation if all task-givers were worked on identically. The grey bars show the standard error over 1000 episodes. The model replicated human crowdworker behaviour, preferring to work on tasks that are of higher interest to it (target).
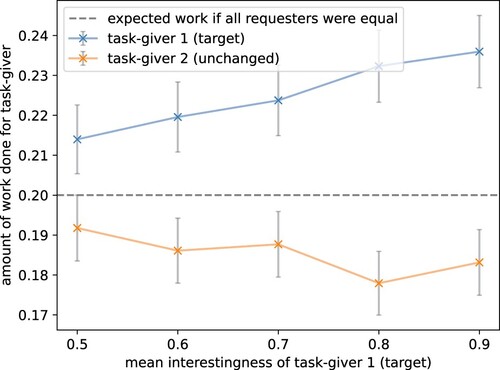
Figure 8. Payout is dominant over interest in regards to increasing participation. For one task-giver, the mean payout was increased and for another the mean interest value. This was performed by setting the first parameter of the beta distribution from 10 to 15, 23.33, 40, and 90 resulting in mean payout rewards of 0.5 to 0.9 and mean interestingness rewards of 0 to 0.4. The parameters of the distributions for the other three task-givers were left unchanged (plot visualises task-giver 3). The dotted line shows the theoretically expected participation if all task-givers were worked on identically. The grey bars show the standard error over 1000 episodes. The model replicated human crowdworker behaviour, considering the payout more important than the interestingness of a task.
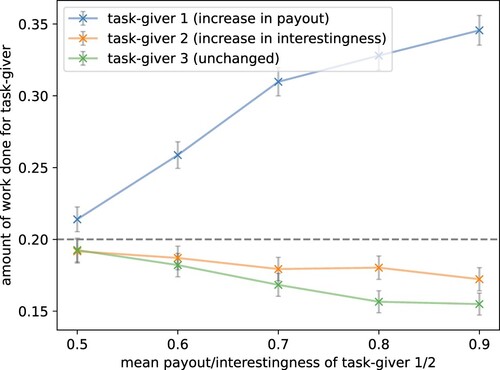
Figure 9. Ratios of actions taken by the agent. Orange bars are without measurements that deter cheating and green bars with 0.1 gold questions and 0.9 minimum reputation level. Mean over 1000 episodes. Like it is regularly observed for actual crowdworkers, the agent often answered negligently, i.e. cheated. Introducing gold questions and a reputation system, which are popular in real crowdworking settings, also helped here to deter cheating.
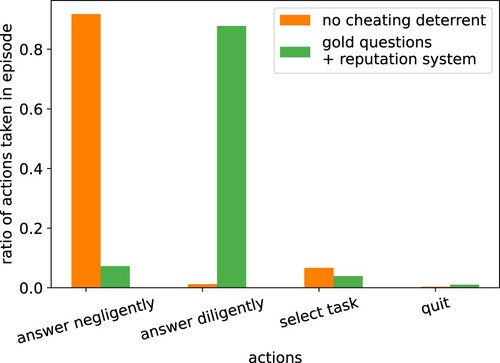
Figure 10. Mean reward per episode by different crowdworker models in an environment without (orange) and with (green) cheating deterrents. The diligent worker model always answers diligently, the cheating worker model always answers negligently and the myopic worker answers in the way that gives the highest reward for the next action. Only our adaptive worker model can replicate the behaviour of human crowdworkers, considering long-term rewards and adapting accordingly.
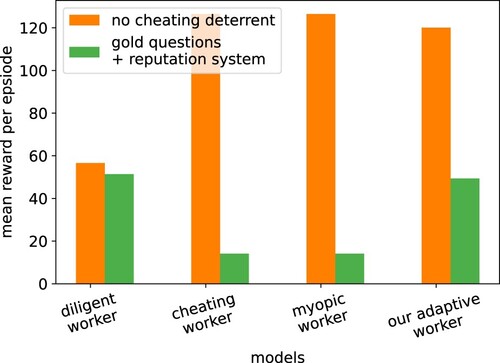
Figure 11. C.1 Workers search for tasks: The trajectories of the tasks worked on for two randomly sampled episodes. The agent tried out tasks until it found the preferred task (marked with *).
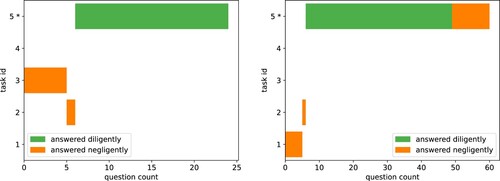
Figure 12. C.1 The length of task search is limited: Rate of episodes (over 1000 episodes) where the preferred task was found and worked on (blue bars) and the number of task select actions performed by the agent (black line). The number of task changes stayed in the same range while the times the preferred task was found decreases strongly, showing that the agent does not search for the preferred task if the search takes too long.
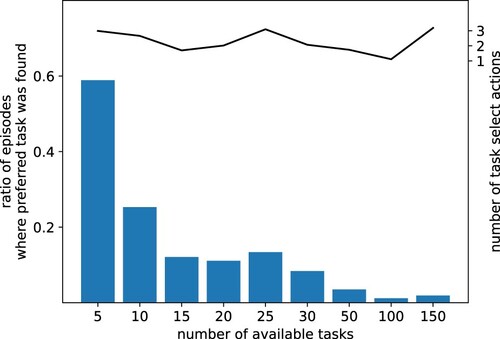
Figure 13. Cheating behaviour eliminates interestingness effect. The experiment for effect A.3 (Section 5.1) was repeated but without cheating deterrents (gold questions and reputation system). The mean interestingness reward (or enjoyment) of the target task-giver was increased from 0.5 to 0.9. In the previous scenario that discouraged cheating, making the task more interesting had a clear effect (green line in this plot). Here, the interestingness effect disappeared as the agent preferred to cheat instead of working on and enjoying the task.
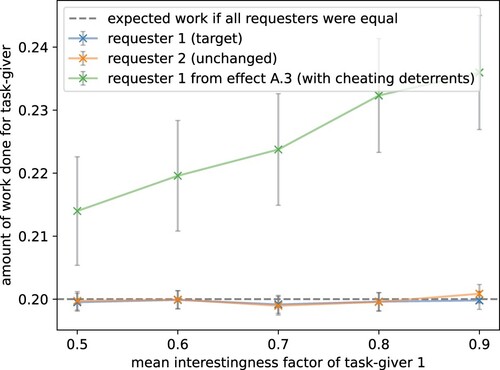
Figure 14. The larger the pool of available tasks, the more the agent cheats. Measuring the percentage of actions taken for an increasing number of available tasks. Each task contained gold questions and a worker was blocked from the task if they failed 3 gold questions. However, no reputation system across tasks was used. In a small market with few tasks, the agent answered mostly diligently and there was nearly no cheating. In a market with a large pool of tasks, like in crowdworking, the worker had a high incentive to cheat, i.e. answer negligently.
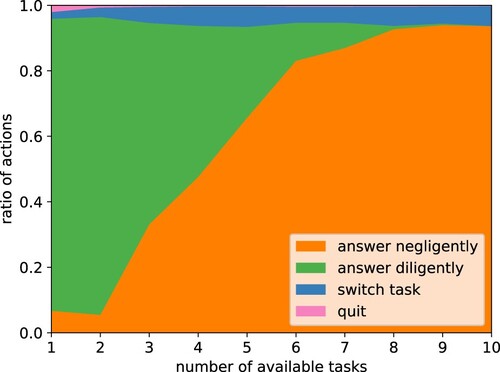
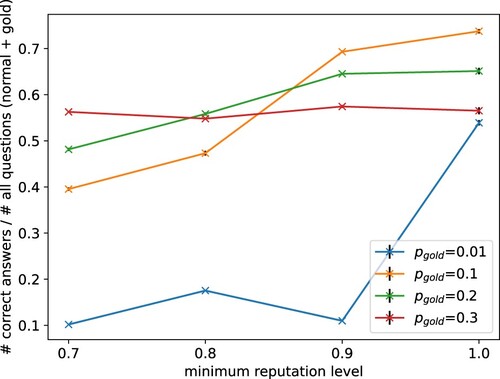
Figure 15. Too high reputation levels are detrimental to the number of answers. Our results show that a high threshold can also eliminate honest and good workers that just made a few mistakes; thus reducing the pool of available workers. This is reflective of real-world crowdsourcing settings. The plot shows average number of correct answers received by all task-givers for different minimum reputation levels and gold-standard questions. The grey bars show the empirical standard error over 1000 episodes. Requiring a perfect reputation of the worker actually decreases the number of received correct answers since the worker makes non-malicious mistakes.
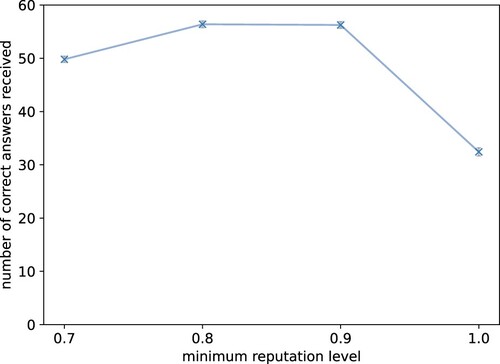
Figure 16. Costs and quality of answers need to be balanced. Average ratio between the number of correct answers received (new information) and the number of questions (normal and gold = costs). Settings with few gold questions were cheap but obtained few correct information. Settings with many gold questions were too expensive compared to the amount of new information obtained.