Figures & data
Figure 1. Comparison of Middlesex Wheat Prices (black dots) with Norfolk, Sussex, and Kent (grey dots), with calculated annual average as bars (calendar years, shillings per quarter).
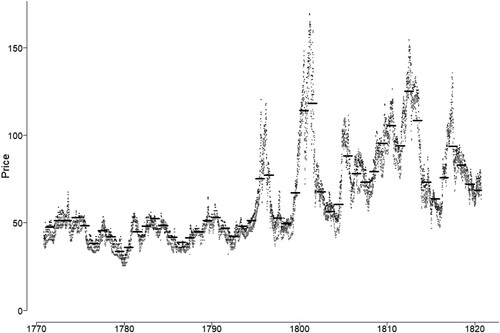
Figure 2. Weekly Price Differences (shillings per qr. of wheat) for Norfolk, Sussex and Kent with respect to Middlesex.
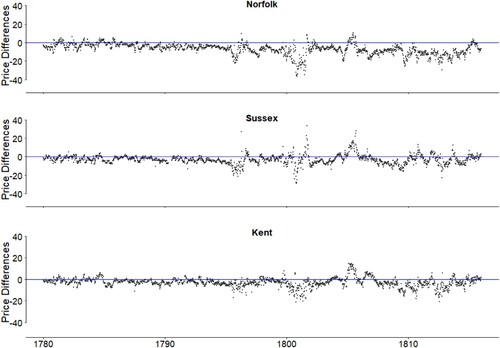
Figure 3. Weekly Wheat Prices 1791–99 in shillings per quarter: scatter plot for Middlesex, Sussex, Kent, Norfolk, with annual average indicated by thick line segments.
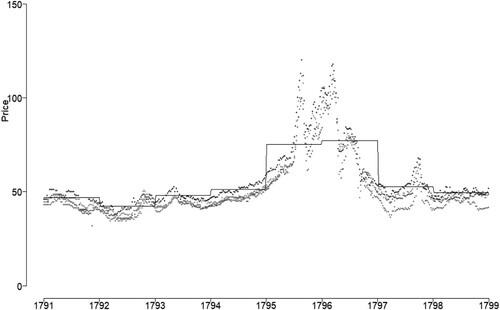
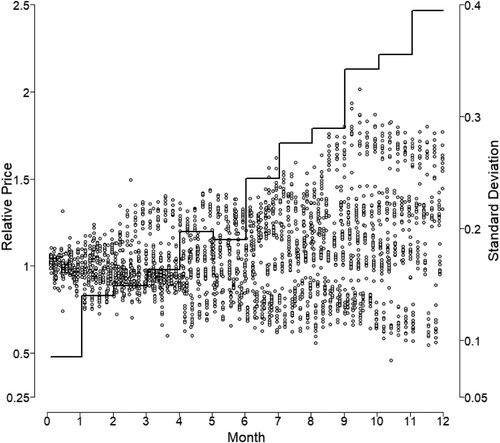
Figure 4. Box and Whisker Plot of .
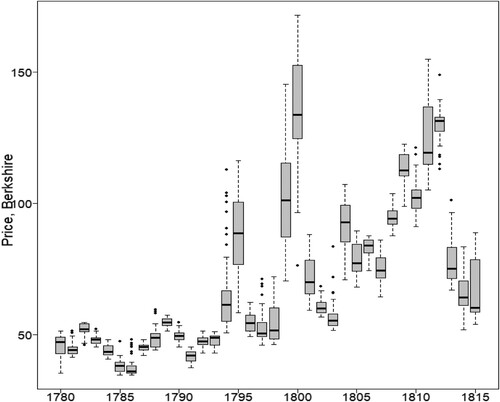
Table 1. Berkshire Wheat Prices 1780–1815 in shillings per quarter, harvest years commencing September of each calendar year.
Figure 5. Graph for Evolution of Berkshire Wheat Prices over the Harvest Years 1791–98 (shillings per qr.).
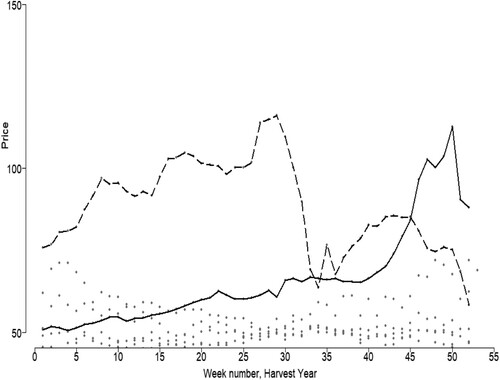
Figure 6. Range of annual weekly prices relative to September in each Year, eleven local Norfolk Markets, October 1820-July 1828.