Figures & data
Table 1. Sample description.
Figure 1. Distribution of sleep onset (panel A) and wake-up time (panel B) by country and type of day.
Source: Own Calculations from the Multinational Time Use Study (MTUS) (Fisher et al., Citation2019).
Boxplots represent the interquartile range (IRQ) with the horizontal line indicating the median sleep onsets (Panel A) and wake-up times (Panel B) separately for schooldays and non-schooldays and by country. The more stretched the box plots are, the greater the heterogeneity within countries is. The whiskers represent the lowest and highest values still within the 1.5 IQR of the lower and upper quartiles. Dots correspond to individuals who report data outside of the whiskers. The country abbreviations are as follows: NL (the Netherlands), UK (United Kingdom), ZA (South Africa), FI (Finland), FR (France), HU (Hungary), IT (Italy), ES (Spain), KR (South Korea).
Table 2. Averages of the sleep parameters on schooldays and non-schooldays by country.
Table 3. Linear mixed models with ID as random effect for sleep duration, sleep duration and wake-up time.
Figure 2. Proportion of respondents asleep by type of day.
Source: Own Calculations from the Multinational Time Use Study (MTUS) (Fisher et al., Citation2019).
Analyses show the percentage of respondents asleep in each country for every 10-minute slot activity between during the 24 hours of the day.
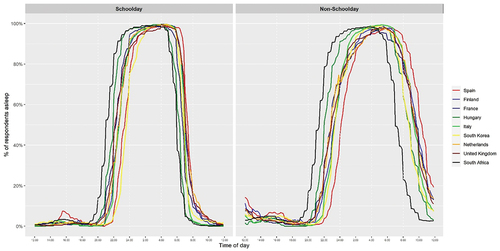
Table 4. Linear (mixed) models for sleep duration, sleep onset and wake-up time by country.
Figure 3. Insufficient sleep (measured as less than 8 hours of sleep per day) by type of day and country.
Source: Own Calculations from the Multinational Time Use Study (MTUS) (Fisher et al., Citation2019).
The country abbreviations are as follows: NL (the Netherlands), UK (United Kingdom), ZA (South Africa), FI (Finland), FR (France), HU (Hungary), IT (Italy), ES (Spain), KR (South Korea).
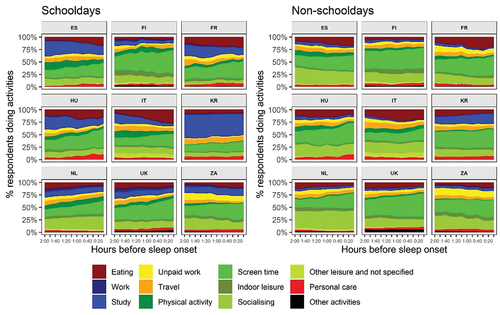
Figure 4. Tempo-graphs of activities carried out 2 hours before sleep onset for schooldays and non-schooldays.
Source: Own Calculations from the Multinational Time Use Study (MTUS) (Fisher et al., Citation2019).
Activities in the graphs are in the same order as in the legend. The country abbreviations are as follows: NL (the Netherlands), UK (United Kingdom), ZA (South Africa), FI (Finland), FR (France), HU (Hungary), IT (Italy), ES (Spain), KR (South Korea).