
Figures & data
Figure 1. Typologies of Urban Sprawl.
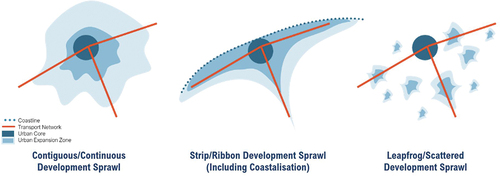
Table 1. Various methodology to measure urban sprawl.
Figure 2. Dimensions and metrics of multidimensional sprawl indicators.
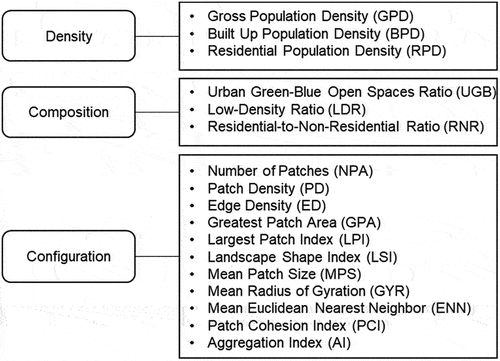
Figure 3. Positioning of Island/Archipelago Spatial Plan in Indonesia’s Planning System.
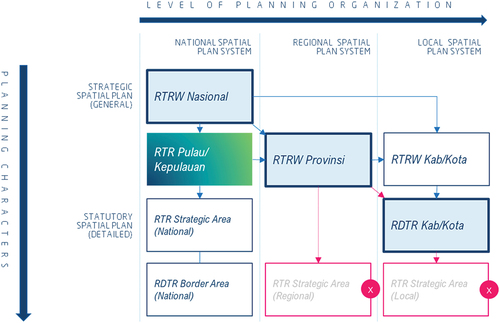
Table 2. Case study areas.
Figure 4. Case study areas: 15 Island Cities/Towns.
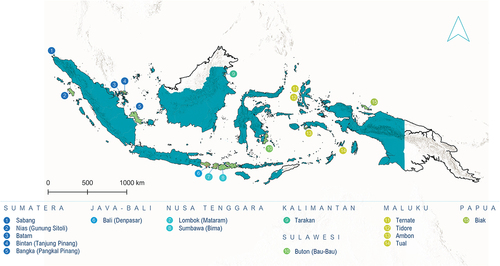
Table 3. Data, sources and types.
Figure 5. Distribution of settlement areas in 15 island cities/Towns.
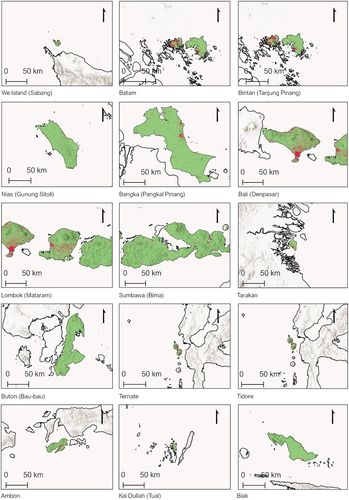
Table 4. Classification of morphological settlement zone grouped into categories.
Table 5. Density dimension calculation summary.
Table 6. Composition dimension calculation summary.
Figure 6. Settlement Land Uses Characteristics in 15 Island Cities/Towns.
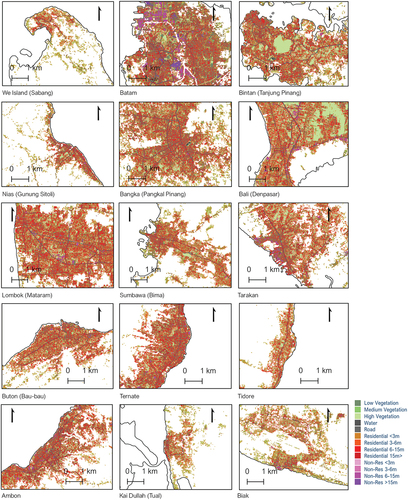
Table 7. Configuration dimension calculation summary.
Figure 7. Configuration Dimension.
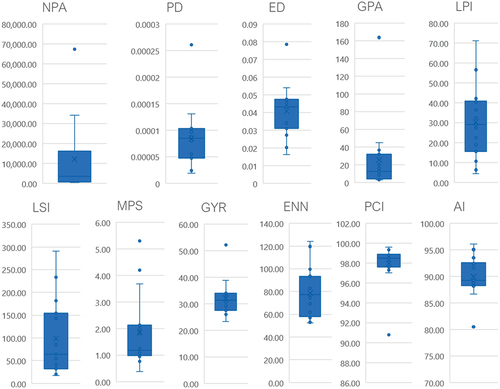
Figure 8. Radar chart multidimensional sprawl assessment.
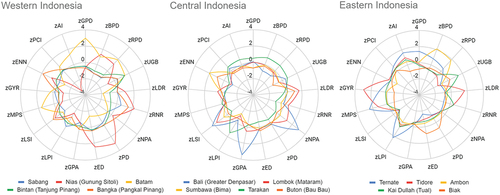
Table 8. Urban sprawl index calculation summary.
Figure 9. Correlation Matrix.
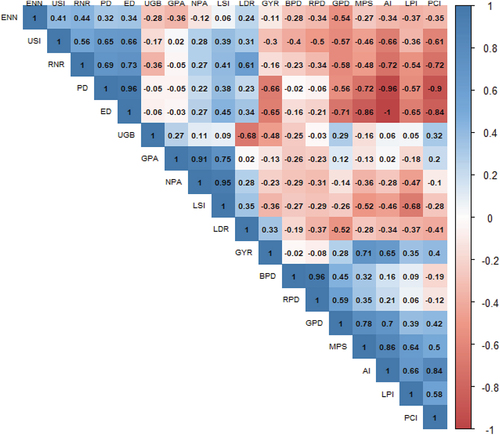
Table 9. Welch’s ANOVA test calculation summary.
Figure 10. Post-Hoc Analysis.
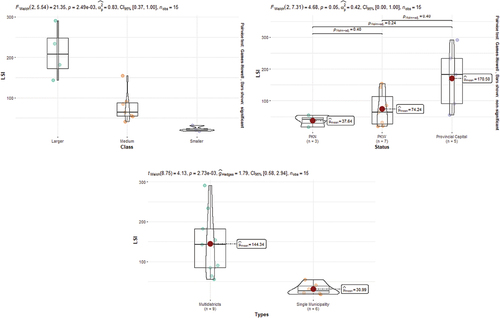
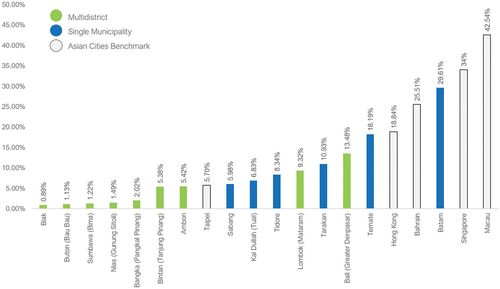
Figure 11. Urban built-up share comparison with Asian Island Cities.