
Figures & data
Figure 1. Location of the sampling sites.
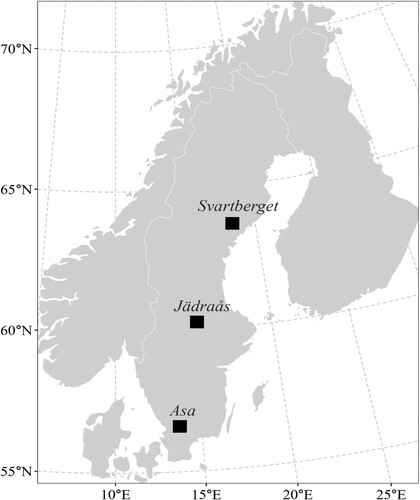
Table 1. Summary statistics for the data set inventoried in 2002, for 31 Norway spruce, 40 Scots pine and 14 birch trees.
Figure 2. Variation in the average tree-level C concentration of different tree species. Results from the ANOVA test (the F-test statistic and the p-value) are presented along with multiple pairwise paired t-tests between the different tree species (ns = not statistically significant, ** and *** show significant differences with adjusted p-values 0.01 < p < 0.001 and p < 0.001, respectively). The amount of variation within species () was 26%. The boxplot shows the mean (red dots), the median (horizontal lines) and the 25th and 75th quartiles.
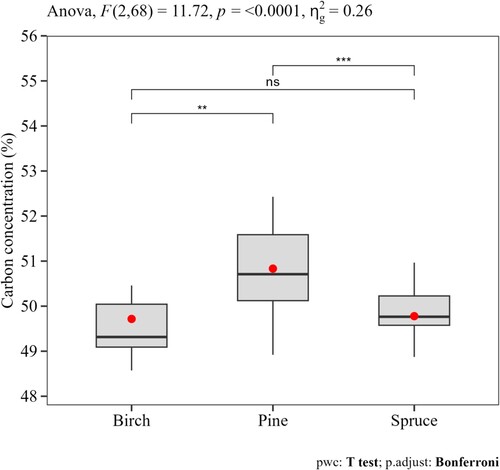
Table 2. Tree-level average (± standard error) C concentration (%) per species and components at different areas.
Figure 3. Variation in C concentration among tree components. Results from the ANOVA test (the F-test statistic and the p-value) are presented along with multiple pairwise paired t-tests between the different tree components (ns = not statistically significant, ** and *** show significant differences with adjusted p-values 0.01 < p < 0.001 and p < 0.001, respectively). The amount of variability due to the within-fraction factor () was 57%, 21% and 19% respectively for birch, spruce and pine. The boxplot shows the mean (red dots), the median (horizontal lines) and the 25th and 75th quartiles.
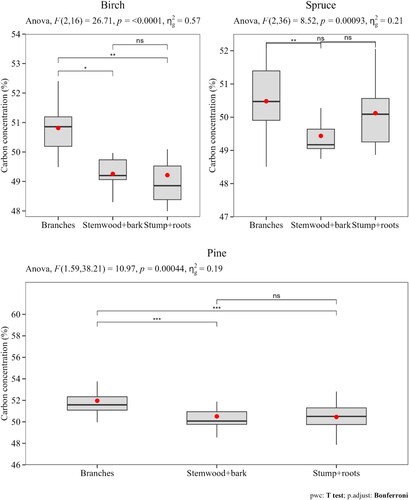
Figure 4. Average C concentration at breast height (dbh – 1.3 m from the ground), and other four locations (1, 2, 3, 4) systematically scattered along the stem after standard assortment (i.e. timber and pulpwood).
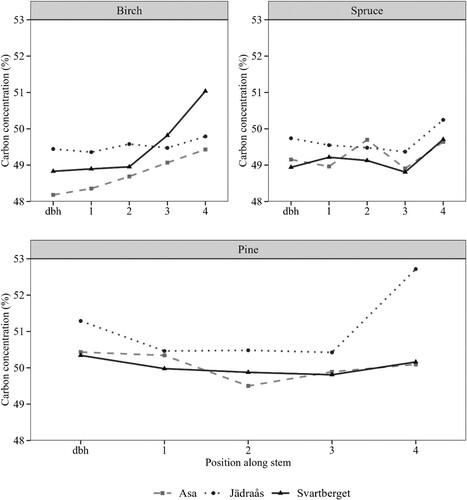
Table 3. Parameter estimates of the mixed model (EquationEquation 4(4)
(4) ) describing the effects of tree, stand, and site characteristics on the C concentration of branches, stemwood and stumps.
Figure 5. The Bland-Altman plot of agreement between C concentrations of branches, stumps and stemwood for birch, spruce and pine. The y and x axes show the difference and average C concentrations between the compared components (stemwood versus stumps and stemwood versus branches). The black (solid) lines represent the average difference in C concentration between branch and stemwood (left panel) and stump and stemwood (right panel). The dashed (red) lines represent the 95% confidence intervals of agreement.
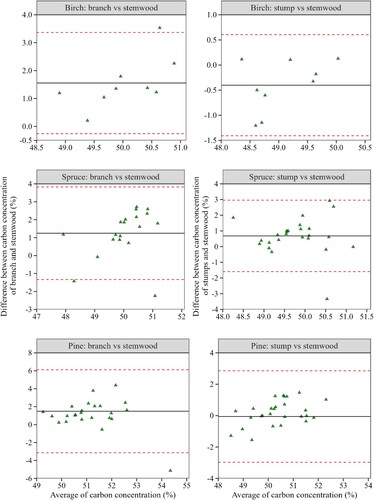
Table 4. Total biomass (million tonnes) and average weighted carbon (C) concentration (%) per species and components for all trees on Forestlands inventoried by the Swedish NFI in the period 2018–2022.
Figure A1. The number of trees per species inventoried on all plots and sites (A) and the sub-sampled trees for destructive measurements (B) in 10 cm diameter classes.
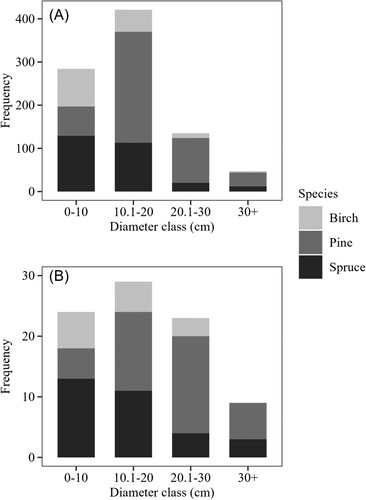
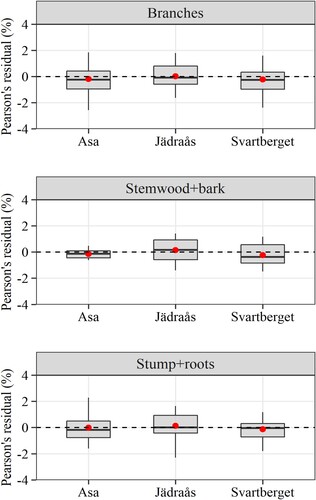
Figure A2. Residual distribution over sites. The residuals are from the mixed-effects linear regression model describing the effects of tree, stand and site characteristics on the average carbon concentration in tree components.
Data availability
Data will be made available on request.