
Figures & data
Figure 1. XRD pattern for ZnO-NP (bottom) and ZnO-mSiO2 nano-composite (top).
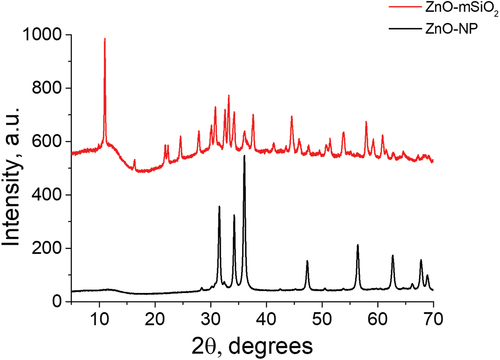
Figure 2. TGA data for the ZnO-NP (a), and ZnO–mSiO2 (b) samples.
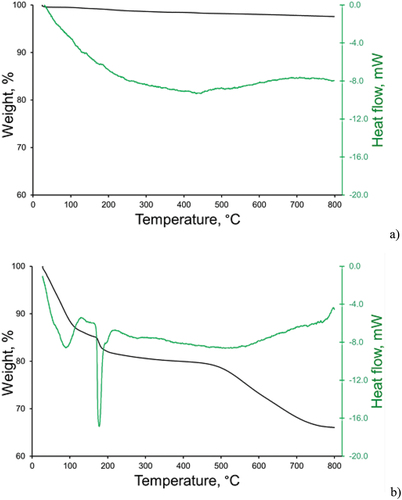
Figure 3. Nitrogen adsorption-desorption isotherm for ZnO-mSiO2 and the pore size distribution (insert).
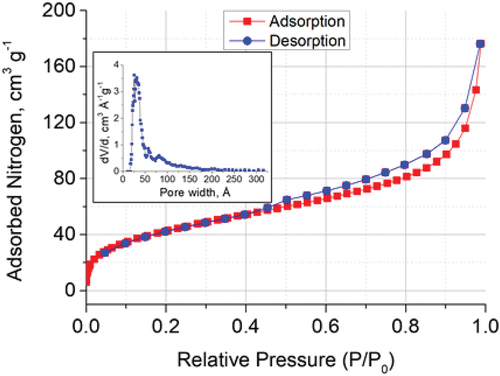
Table 1. The pore volume and surface area data obtained for mSiO2, Zn-NP and ZnO-mSiO2..
Figure 4. Effect of pH on Pb (II), Cd (II) and Cr(III) adsorption (% removal from solution), with initial solution concentration 100 mg/L, 25 mg sorbent, 25 mL solution volume and 3 h equilibration time.
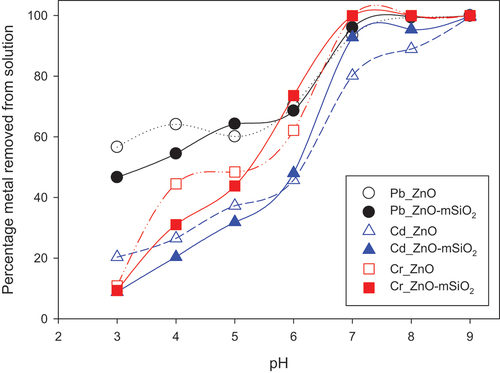
Figure 5. Effect of contact time on Pb (II), Cd (II) and Cr(III) removal percentage at pH 7, initial concentration 100 mg/l, 25 mg sorbent and 25 mL total volume.
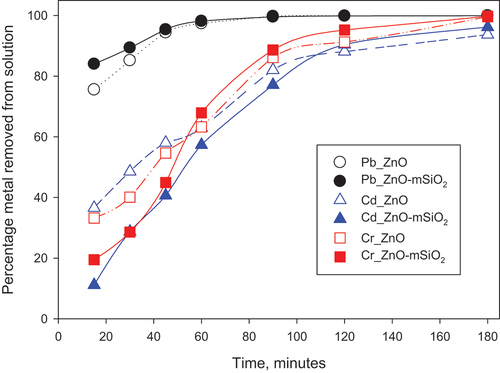
Figure 6. Effect of adsorbent dose on a) removal efficiency and b) amount sorbed (mg/g) of Pb (II), Cd (II) and Cr (III) with conditions set at pH 7, temperature 25°C, total volume 25 ml, and initial Pb, Cd and Cr concentration 100 mg/L.
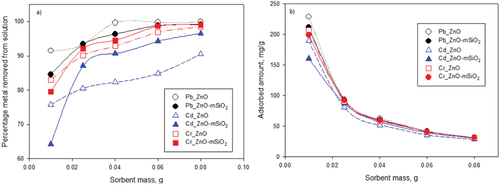
Figure 7. Effect of initial concentration of Pb (II), Cd (II) and Cr(III) on removal percentage by the adsorbents with conditions set at pH 7, temperature 25°C and sorbent dose 25 mg : 25 ml solution.
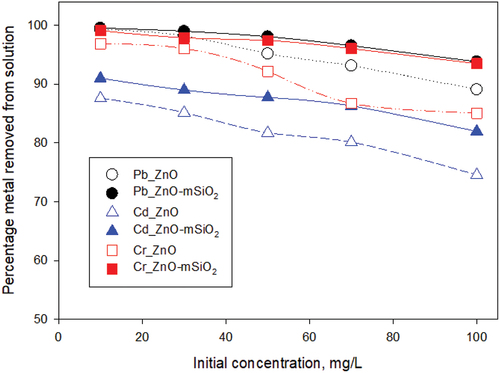
Table 2. Freundlich and Langmuir linear isotherm model parameters and equations.