Figures & data
Figure 1. Study area map.
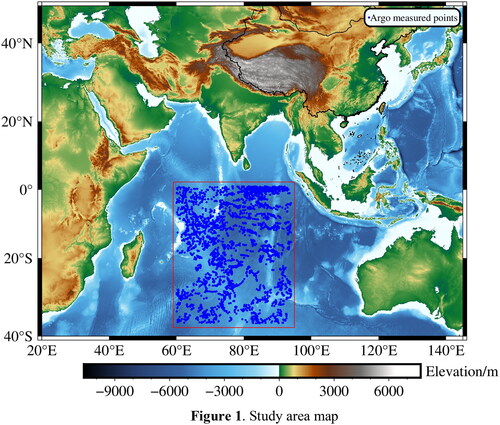
Figure 2. Technical roadmap.
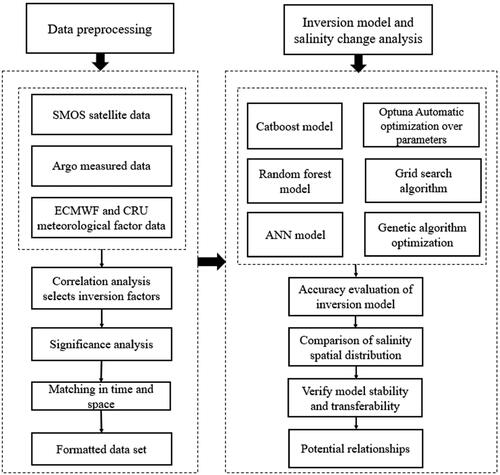
Table 1. Parameter optimization results for the three models.
Figure 3. Correlation analysis between SSS and meteorological data.
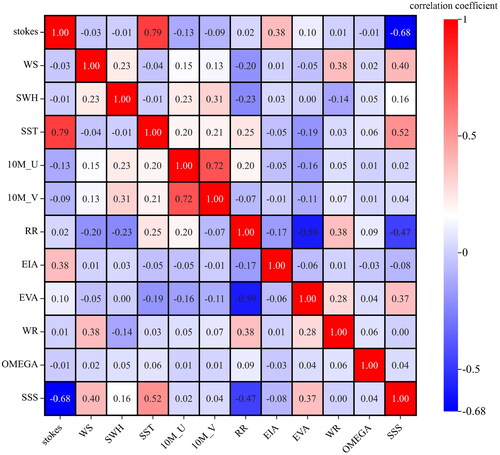
Figure 4. The relationship between the number of features entered and R²/time.
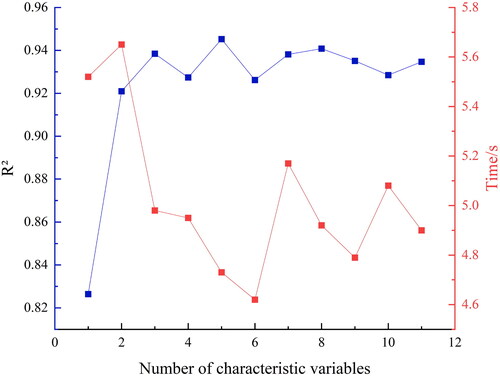
Figure 5. Significance analysis of meteorological features.
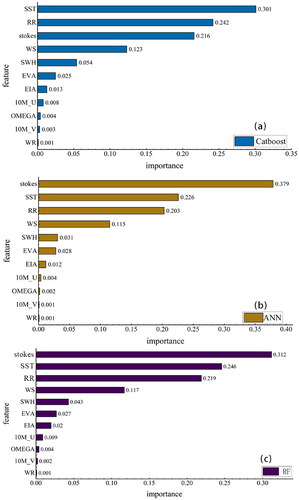
Table 2. Evaluation indicators results of the training set and test set.
Figure 6. Scatter plots of inversion model.
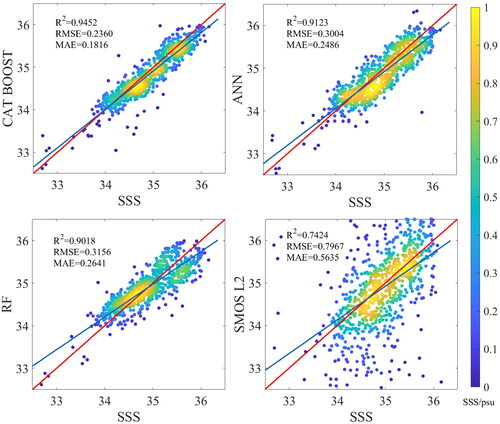
Figure 7. Histogram of the error between the salinity inverted by the model and the salinity measured by Argo.
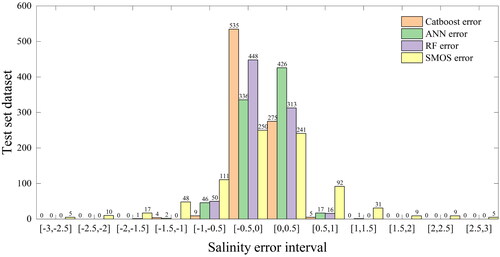
Figure 8. Spatial distribution of salinity of Argo, Catboost, ANN, RF and SMOS.
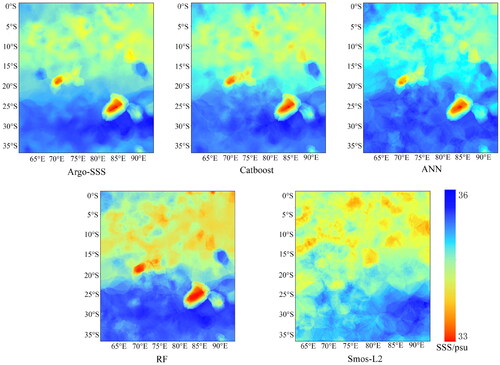
Figure 9. Salinity residual distribution of Catboost, ANN, RF and Argo.
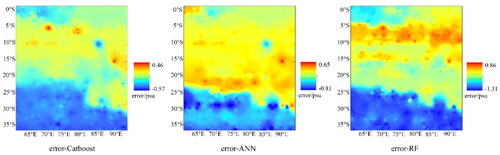
Figure 10. R² of the random error model.
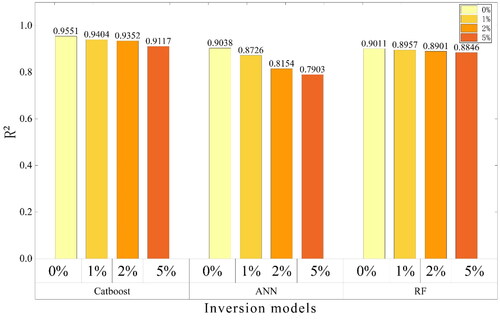
Table 3. RMSE and MAE of the random error model.
Figure 11. Salinity inversion results of machine learning in the south China Sea.
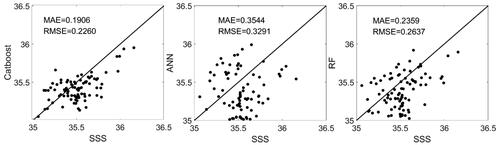
Table 4. The measured buoy site in South China sea.
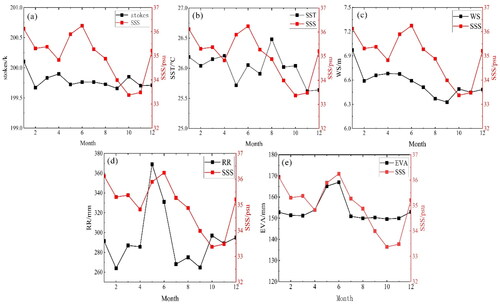
Figure 12. Potential relationships between meteorological characteristics and salinity changes.