
Figures & data
Figure 1. Four levels of detail (LoDs) represent building models. As the level of detail increases, the geometric detail and semantic complexity also increase.
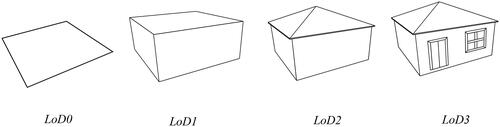
Figure 2. The windows are obstructed by trees and billboard.
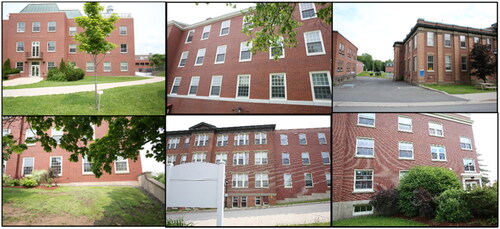
Figure 3. Dataset compilation from single-sided facades (FC 1- FC 12).
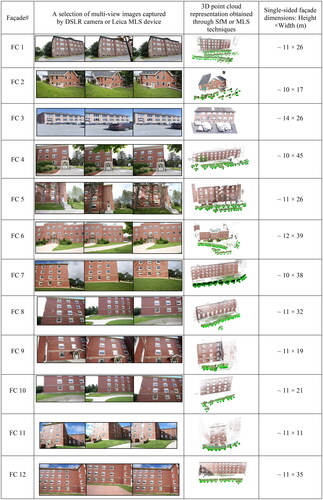
Table 1. EOPs accuracies for two datasets, coordinates in meters, and angles in degree unit.
Table 2. The specifications of data collection devices.
Figure 4. The overall flowchart of the proposed method.
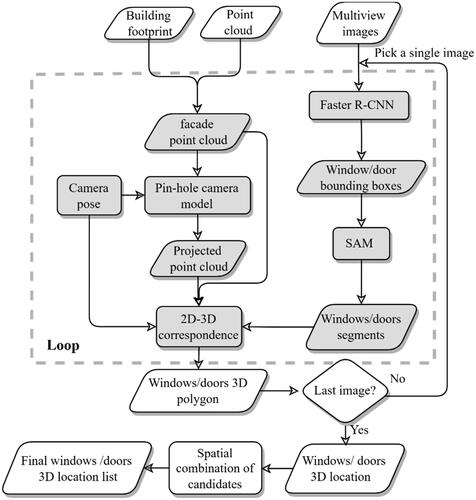
Figure 5. The pseudo-code of the proposed method.
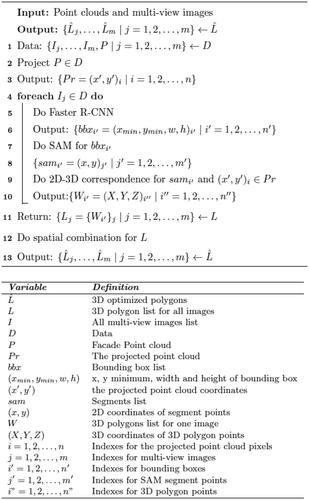
Figure 6. The overlaid bounding boxes (green) on single view façade images captured by DSLR cameras (a), and Leica MLS device (b).
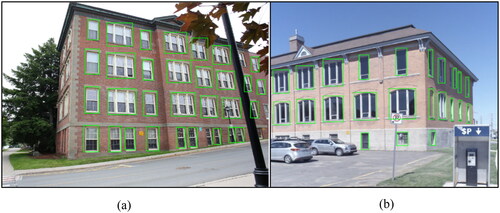
Figure 7. a) A single view façade image captured Fredericton residential area b) detected windows and doors bounding boxes by Faster-RCNN c) refined 2D SAM segments.
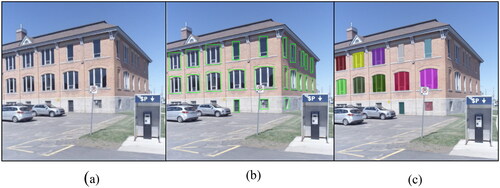
Figure 8. a) A single view façade image captured Fredericton residential area b) projected point cloud overlaid on the image.
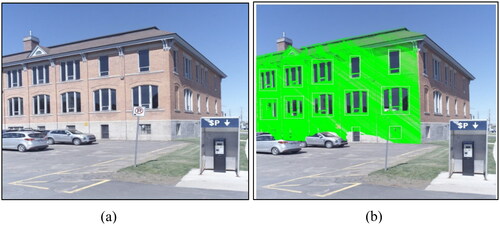
Figure 9. 2D-3D correspondence and buffering process. (a) projected point cloud on a single view façade image b) overlaid 2D border segment (red color) c) SfM point cloud d) buffered corresponding 3D point cloud, e) removed noisy window points.
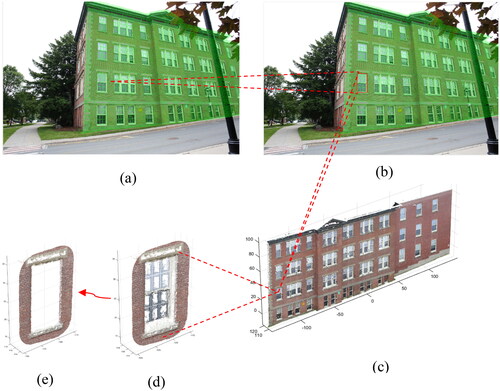
Figure 10. The process to generate facade elements 3D locations. a) A single view façade image captured UNB campus b) overlaid a 2D polygon from SAM (red color) c) the projected 3D polygon overlaid on SfM point cloud d) zoomed in the projected 3D polygon.
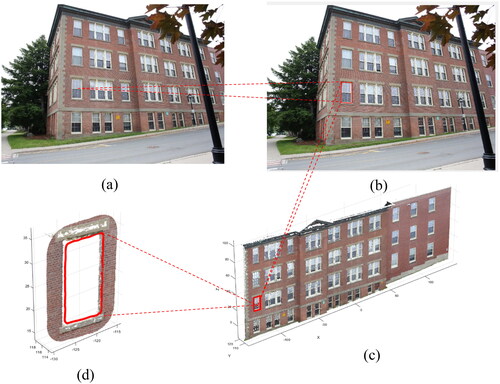
Figure 11. Three samples of overlapping 3D polygons (window border candidates) across three image views. a) Overlapping 3D polygons for a single window b) 2D polygons in different view angles.
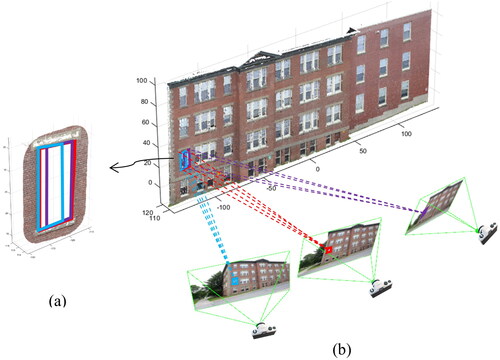
Figure 12. Overlaid 3D polygons on the single-sided façade point clouds (FC 1-12).
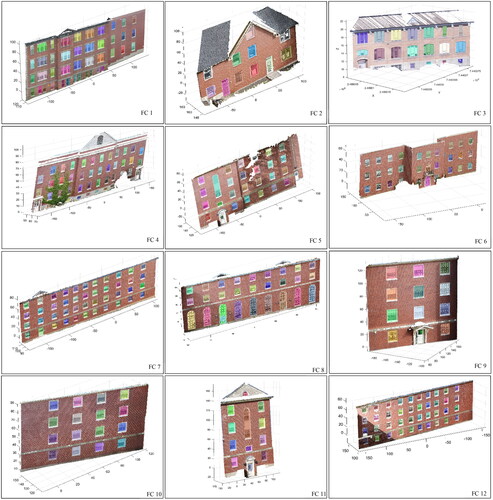
Figure 13. Detected incorrect objects (yellow dash line circles) in the two different image views.
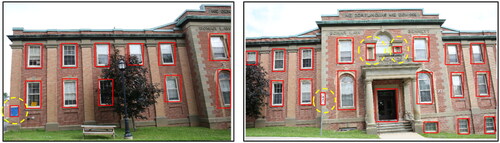
Table 3. Mean and standard deviation of IoU values for the final 3D polygons of facade elements, and the number of façade elements and images used in the implementation.