
Figures & data
Figure 1. 2021 Canadian farm distribution map for strawberry fruit production (Government of Canada Citation2022a; Government of Saskatchewan Citation2023; Statistics Canada Citation2022).
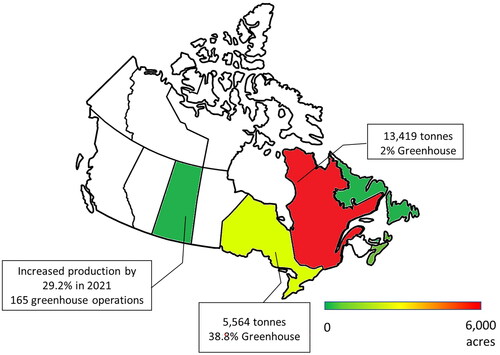
Figure 2. Complete schematic workflow of the NID based detection system.
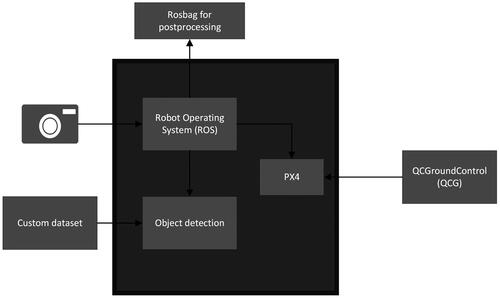
Figure 3. Visual spectral Sensitivity of Western Honey Bee vs. Human. Dotted black, blue, and green lines represent bee UV, B, G. Solid red, green and blue lines represent human R, G, and B (Coliban et al. Citation2020; Dyer et al. Citation2015).
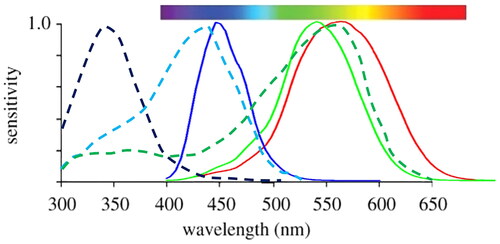
Figure 4. Internal visual remote sensor design. (a) GoPro Hero 9 RGB action camera (b) NID monochrome camera. * 80% transmission, ** >91.5% transmission, ***>10% transmission. (Bandara Citation2011; Corning Inc Citation2022; Dyer et al. Citation2015; Nieto et al. Citation2012; Präzisions Glas & Optik Citation2023; Taguchi and Enokido Citation2017).
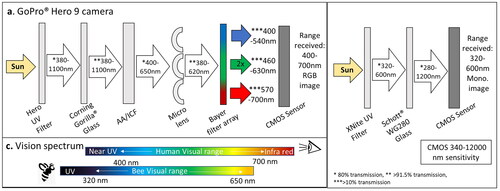
Figure 5. Transmission spectrograph for materials of NID camera. The blue line represents WG280 Schott glass, and the pink line represents the XNite BP1 filter. >80% transmission in the 300-650 nm range (LDP LLC—MAXMAX Citation2022a; Schott AG Citation2023).
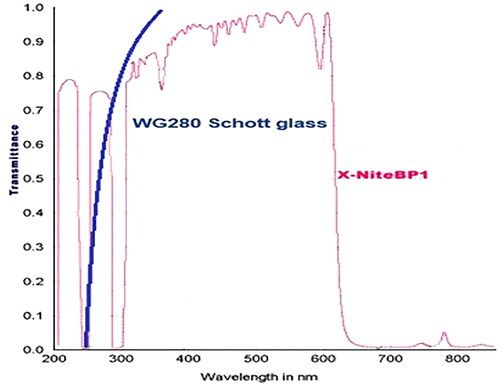
Table 1. Our camera model contrasted with a comparable camera on the market.
Figure 6. UV reflectance standards spectrogram measured with Perkin Elmer’s Lambda 850 UV-VIS spectrophotometer.
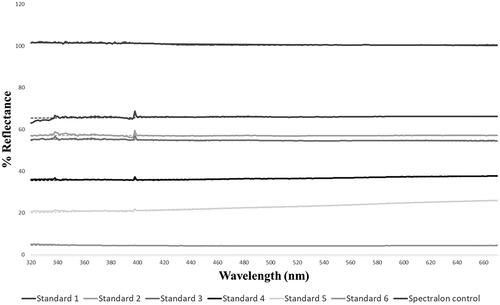
Figure 7. Correlation curve for UV-reflectance standards and image pixel values. % Reflectance measured with Perkin Elmer’s Lambda 850 UV-VIS spectrophotometer. Pixel value from images produced with the NID camera.
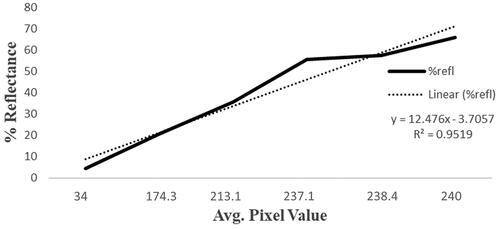
Figure 8. Modified Spiri Mu quadcopter. (A) NID camera held on the underside of UAV facing the ground at 90 degrees. (B) Extended legs to accommodate NID camera mounting.
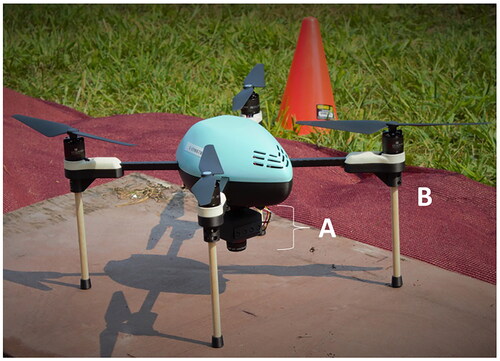
Table 3. Cost and size comparison of Spiri Mu with similar UAV models: DJI Mavic 3 (DJI Citation2023a), and DJI Phantom 4 Pro (DJI Citation2023b), and Spiri Robotics LLC (Citation2023).
Figure 9. Strawberry cultivars. * RGB images from Vesey (Citation2022), ** monochrome images captured with NID camera. The far-right image shows Yolo’s detection of a strawberry flower on the training dataset.
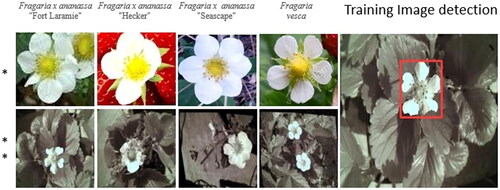
Table 2. Resulting detection from UV-G-B trained YOLOv5 and Faster R-CNN on training dataset at 416 × 416 resolution, and on aerial images at 96 × 96 resolution.
Table 4. Comparison of sensors in similar experimental conditions.
Figure 10. Detection examples from aerial images of (a) TP detections of open flowers and (b) FP from ripening fruits.
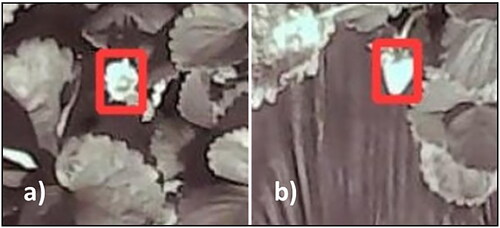
Figure 11. Orthomosaic image analysis. (a) Orthomosaic image of Quebec strawberry farm from NID field deployment. (b) Isolated crop row in the field. (c) Isolated crop row. (d) Detected flowers with YOLOv5 NID. (e) Labeled detections from YOLOv5 NID system; yellow for flowers, pink for false positives.
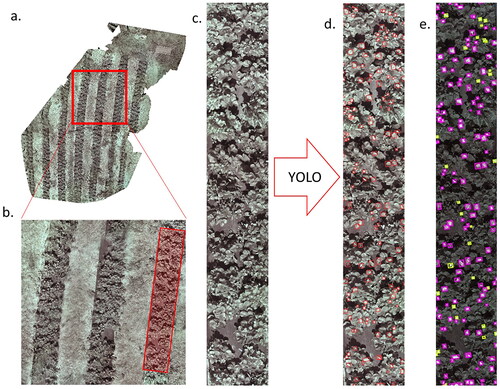
Table 5. Orthomosaic. Algorithm detection vs. ground truth.