
Figures & data
Figure 1. Causal effect of violent victimization between T1 and T2 on (a) feeling unsafe and (b) worry about crime conditional on neighborhood concentrated disadvantage for individuals who already reported violent victimization before T1.
Note: The black lines and their gray ribbons reflect the main models’ effect estimates and 95% confidence intervals. The error bars depict the effect estimates and confidence intervals of sensitivity analyses, in which neighborhood concentrated disadvantage is split into quintiles (the x-axis values of the error bars reflect the mean in the specific quintile groups). The density plots at the bottom depict the distribution of concentrated disadvantage among T1-only victims (dashed line; the “control” group) and T1+T2 victims (solid line; the “treatment” group). The y-axis shown only reflects the values of the conditional victimization effects, while the plot does not include an additional y-axis for the density distribution of concentrated disadvantage.
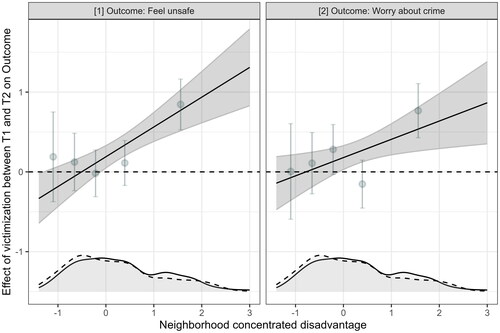
Table 2. Causal effects of T2 violent victimization by neighborhood concentrated disadvantage.
Table 4. Causal effects of T2 violent victimization by neighborhood crime rate.
Table 5. Causal effects of T2 violent victimization by neighborhood disorder.
Table 1. Causal effects of T2 violent victimization by victimization status.
Table 6. Summary–moderation of victimization effects by neighborhood conditions.
Figure 2. Average predictions of (a) feeling unsafe and (b) worry about crime for individuals who reported violent victimization only at T1 or at both T1 and T2 conditional on neighborhood concentrated disadvantage.
Note: The y-axis refers to the predicted values of z-standardized outcomes (i.e. outcomes with a mean of 0 and a standard deviation of 1).
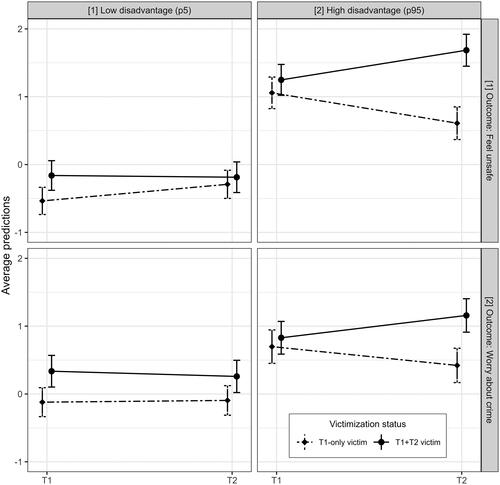
Table 3. Average marginal effects of neighborhood conditions.