
Figures & data
Table 1. Baseline characteristics and comorbidities of patients according to TSH levels before admission.
Figure 1. Patient flow diagram.
Table 2. Length of hospital stay, 30-day and end-of-follow-up mortality according to TSH levels before admission.
Table 3. 30-day and end-of-follow-up mortality according to TSH levels before admission, divided into two age groups: <60 years and ≥60 years.
Figure 2. Kaplan–Meier analysis of long-term mortality according to pre-admission TSH levels. Comparison between TSH levels of ≤ 0.5, TSH levels between 0.5 and 5.0, TSH levels between 5.0 and 10.0, and TSH levels > 10.0mIU/L.
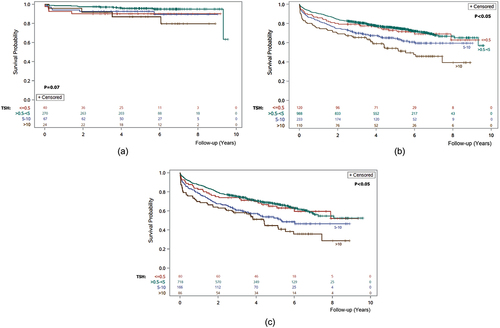
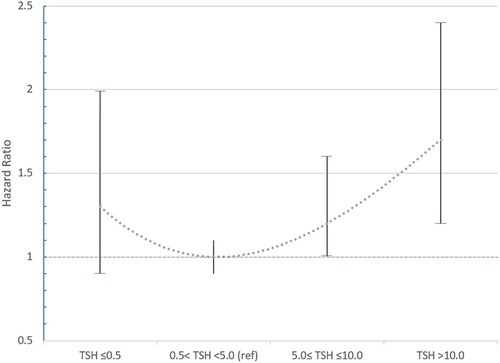
Figure 3. Adjustedend of follow-up mortality hazard ratio according to pre-admissionTSH levels.
Data availability statement
The data that support the findings of this study are available from the corresponding author, AA, upon reasonable request.