Figures & data
Figure 1. Sampling stations of Sanxi and Pinshi WQAMS along Wujiang river.
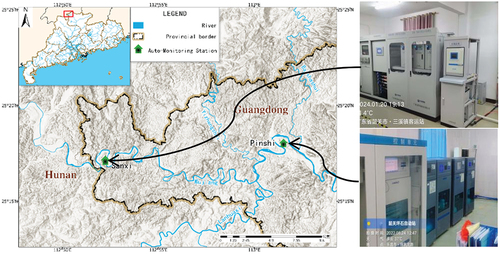
Figure 2. Sanxi WQAMS online simulator and monitor panel.
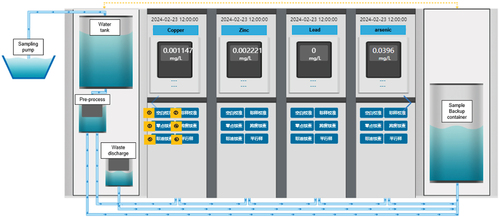
Figure 3. Sampling stations of Sanxi and Pinshi WQAMS along Wujiang river.
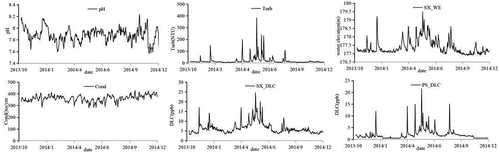
Figure 4. Illustrative map of a typical 3-layer BPANN.
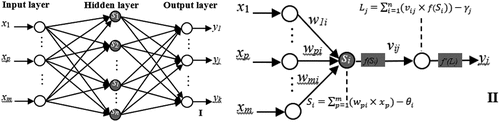
Figure 5. Schematic flowchart of hybrid GA-BPANN.
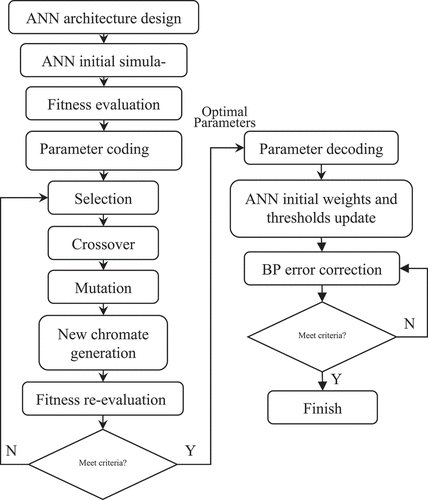
Figure 6. Model input and output structure.
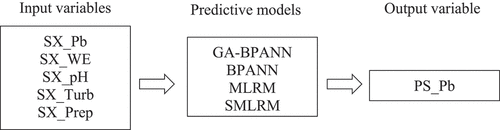
Table 1. Descriptive statistics of calibration data from Oct. 2013 to July 2014.
Table 2. Descriptive statistics of predictive data from Aug. 2014 to Dec. 2014.
Figure 7. Calibration and prediction of DLC at Pinshi station by MLRM, BPANN and GA-BPANN.
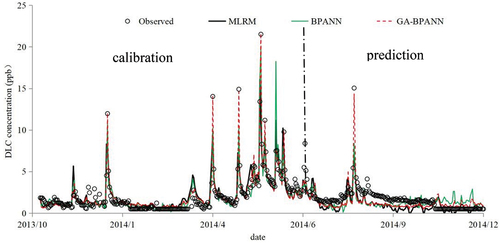
Figure 8. Linear corelative analysis between observed and simulated DLC of Pingshi station at calibration phase.
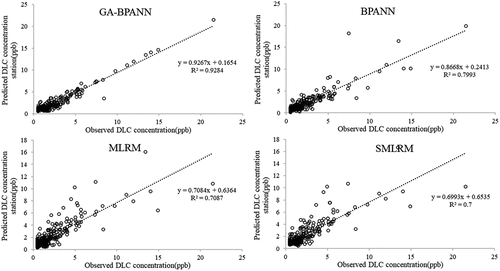
Figure 9. Linear corelative analysis between observed and simulated DLC of Pingshi station at predictive phase.
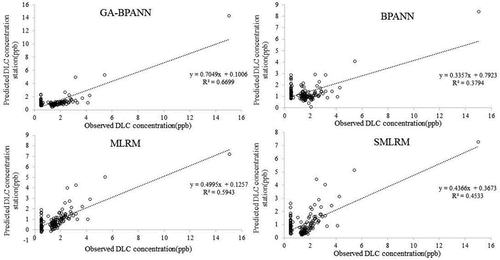
Table 3. Simulated DLC(SDLC) and ARE by various models.
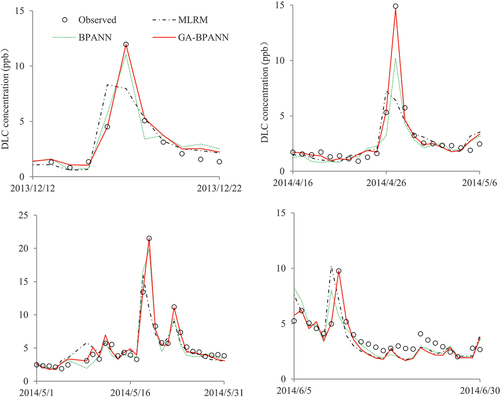
Figure 10. Typical peak DLC process simulation by various models.
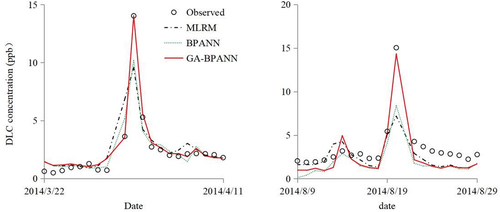
Figure 11. Typical peak DLC process simulation by various models.