
Figures & data
Figure 1. The retention ratio of the Egyptian insurance market from 1989 to 2021.
Table 1. Descriptive statistics of the premium retention ratio of Egyptian insurance market.
Figure 2. Block diagram of the study.
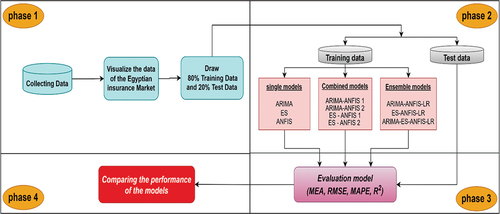
Figure 3. ANFIS structure for the sugeno fuzzy model.
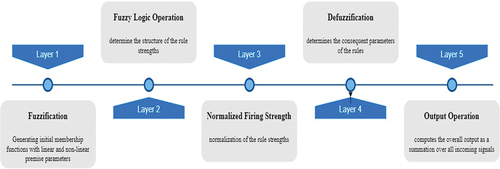
Figure 4. The structure of proposed combination models.
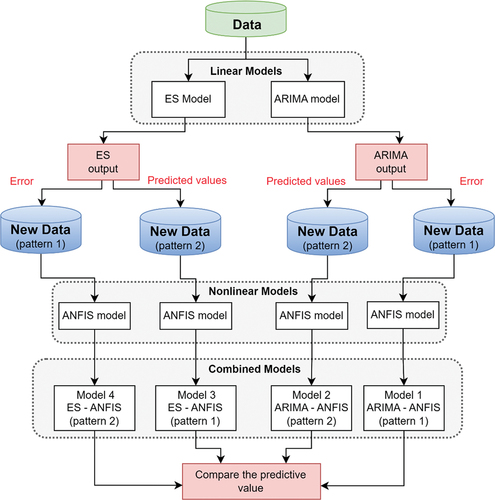
Figure 5. The structure of proposed ensemble models.
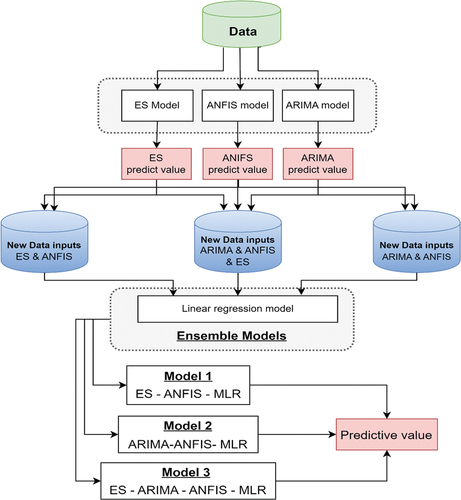
Table 2. The optimal parameters of statistical time series models.
Figure 6. The plot of (ACF & PACF) of the market time series.
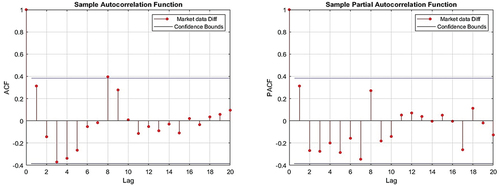
Figure 7. The plot of the ARIMA (2,1,1) model fit.
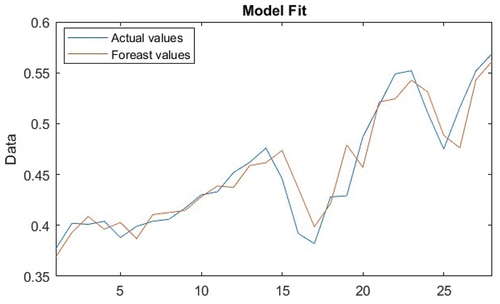
Table 3. The goodness of fit measure of ARIMA models.
Figure 8. The plots of residual normality of ARIMA (2,1,1) model.
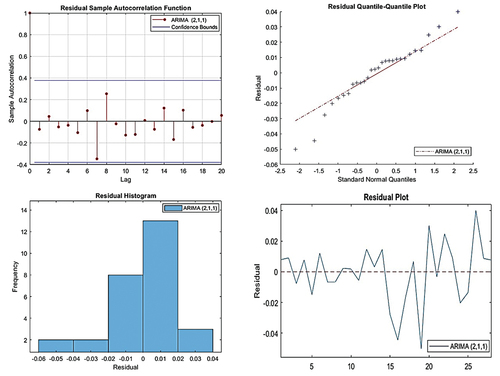
Table 4. The parameters of the ARIMA (2,1,1) model.
Table 5. The accuracy measure of the best ARIMA and ES models.
Figure 9. The plot of the ES model fit.
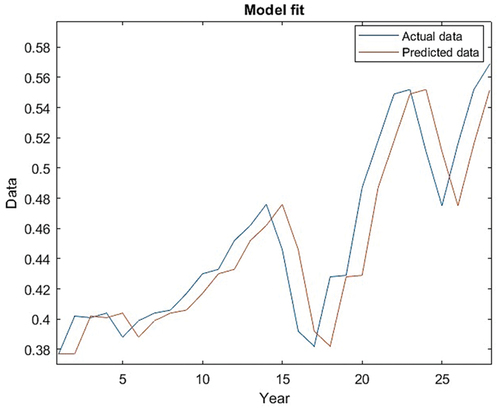
Table 6. The parameters of the best ANFIS model.
Figure 10. Trained membership functions and the structure of ANFIS model.
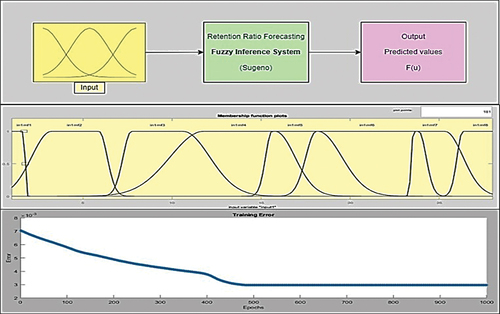
Table 7. The accuracy measure of ANFIS model.
Figure 11. The variation of error and the structure of ARIMA-ANFIS model for pattern (1).
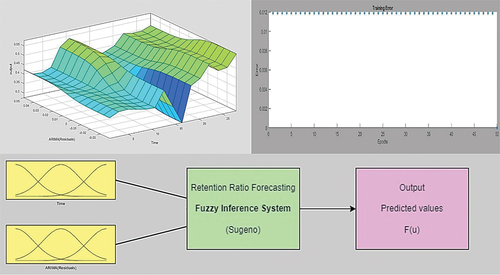
Table 8. The accuracy measure of first pattern of combined model (ARIMA-ANFIS).
Figure 12. The variation of error and the structure of ES-ANFIS model for pattern (1).
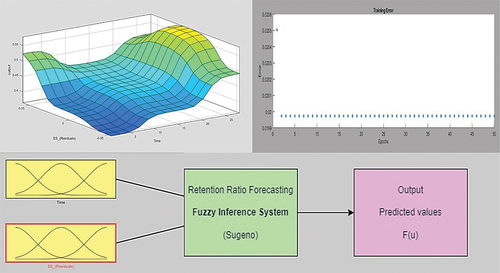
Table 9. The accuracy measure of first pattern of combined model (ES-ANFIS).
Figure 13. The variation of error and the structure of ARIMA-ANFIS model for pattern (2).
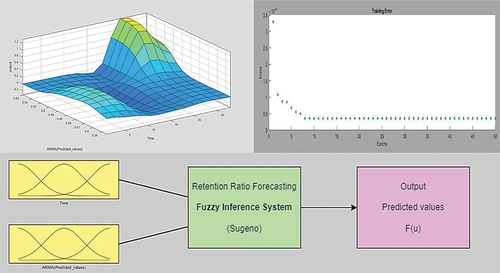
Table 10. The accuracy measure of second pattern of combined model (ARIMA-ANFIS).
Figure 14. The variation of error and the structure of ES-ANFIS model for pattern (2).
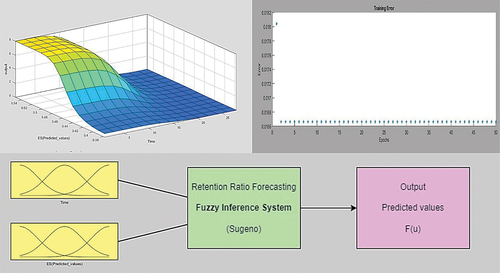
Table 11. The accuracy measure of second pattern of combined model (ES-ANFIS).
Table 12. The accuracy measure of ensemble models.
Figure 15. The comparison of all predictive models (a) single models (b) combined models (c) ensemble models.
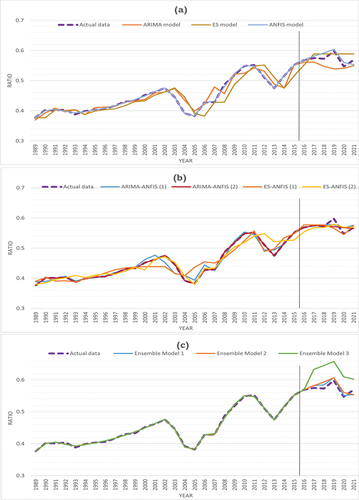
Table 13. The comparison between all the models.
Biographical file.docx
Download MS Word (98.7 KB)Data Availability Statement
The data that support the findings of this study are publicly available on their website (https://fra.gov.eg).