Figures & data
Figure 1. Average coefficient of inbreeding (F) per birth year and number of animals in the pedigree per birth year for the Norwegian Fjord horse population over the period 1857–2016.
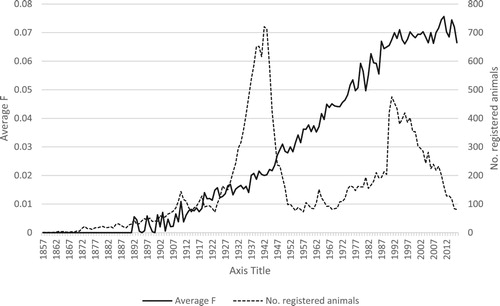
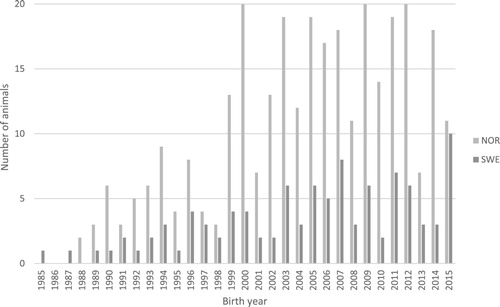
Figure 2. The age distribution of the animals contributing with genotype data (recorded December 2015 to March 2016), shown through the number of animals born per year in the Norwegian (N = 311) and the Swedish Fjord horse populations (N = 102).