
Figures & data
Table 1. Number of genotyped individuals after quality control.
Table 2. An overview of the genetic lines in the Synbreed data set (Weigend et al. Citation2014).
Table 3. Genotyping quality controls performed in PLINK1.9. Filtering was carried out on the lines with >2 individuals per line, i.e. lines from the Norwegian genebank plus the commercial Lohmann lines.
Table 4. Number of lines, individuals and SNPs in the final data sets used in the different analyses.
Figure 1. Heatmap presenting the 8 × 8 genomic relationship matrix with average genomic relationships within and between the lines at the Norwegian gene bank. A lighter shade reflects higher relationship estimates. The ordering of the lines follows the clustering in the dendrogram.
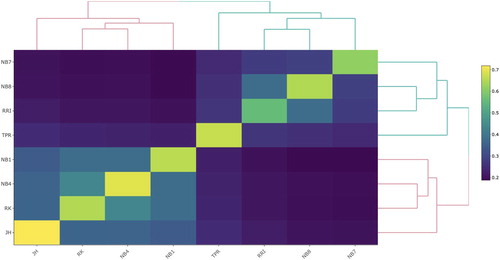
Table 5. Means and standard deviations of the genomic inbreeding coefficient (F) and observed heterozygosity (Ho) within the genetic lines at the genebank.
Figure 2. Graphic presentation of the matrix containing genomic relationships within and between lines in the International data set. Colour is dependent on the genomic relationship estimate, where a lighter colour towards yellow reflects a higher relationship estimate. The ordering of the lines is decided by the clustering in the dendrogram.
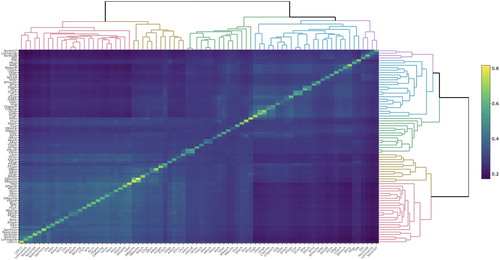
Table 6. Relative loss of genetic diversity when a line is lost from the genebank data set and priority ranking for conservation of genetic diversity.
Table 7. The relative gain in genetic diversity when a gene bank line is added to the core set consisting of the international set excluding the genebank lines.
Table 8. The Relative gain in genetic diversity when a gene bank line is added to the core set consisting of the international set excluding the Lohmann and genebank lines.
Table 9. Pair-wise Fst values between 10 chicken lines based on the LD-pruned Genebank + Lohmann data set.
Figure 3. Individual ancestry estimates for the eight Norwegian genebank lines and the two commercial crossbred layer lines based on an LD-pruned data set for K=2, 6, 9 and 10. Mean similarity score and mean Log-Likelihood value of the 50 replicate runs is given. Each bar represents an individual and genetic lines, labelled at the bottom, are separated by black lines. Colours correspond to the 2, 6, 9 or 10 different presumed ancestries.
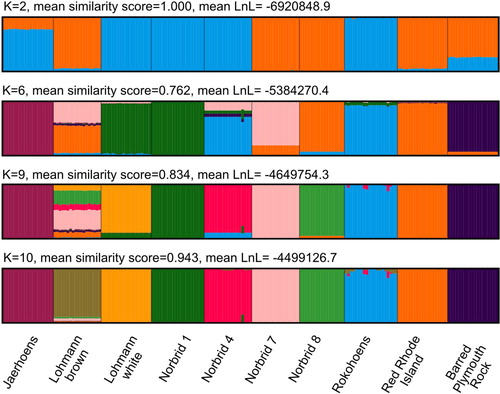
Figure 4. Plot of principal component (PC) 1 against PC 2 based on an LD-pruned data set for two individuals of 80 genetic lines. Individuals are coloured according to the type of their breed/line. The Norwegian genebank lines are marked in a separate light blue colour.
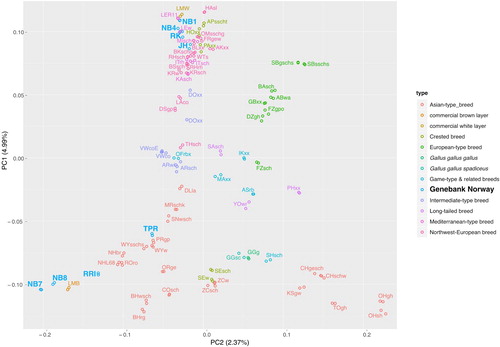
Figure 5. NeighborNet of the eight Norwegian genebank lines and the two commercial crossbred layer lines based on population (line) level Fst values. The main split separates white from brown egg layers.
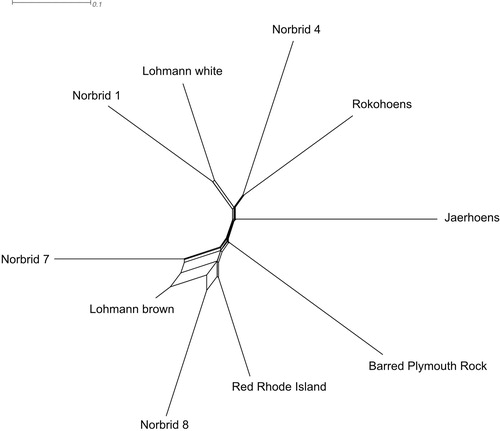
Figure 6. Effective population size estimates 13 generations ago, the most recent generation possible to estimate, for all gene bank lines.
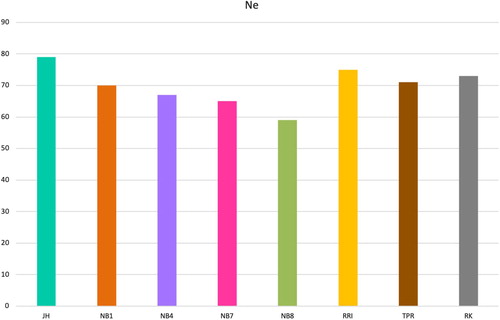
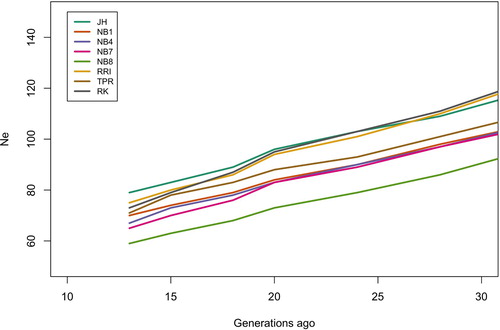
Figure 7. Historical effective population size levels from 30 to 13 generations ago for all the gene bank lines.
Supplemental Material
Download PDF (352.8 KB)Data availability
The data that support the findings of this study are available from the corresponding author, CB, upon reasonable request.