
Figures & data
Figure 1. Morphological appearance of kaffir lime at 4 WATs subjected to various treatments: defoliation and drought stress (A); only defoliation (B); only drought stress (C); control (D). Note: The yellow line in the figure is equal to 100 cm.
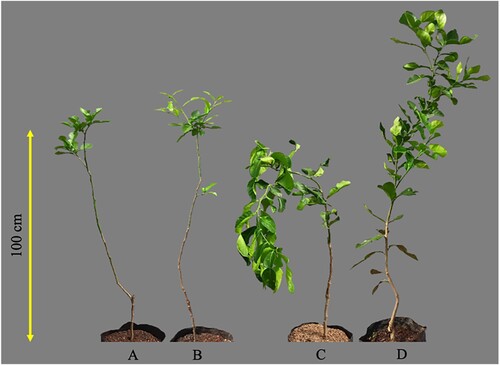
Figure 2. Morphological appearance of kaffir lime flush at 4 WATs subjected to various treatments: defoliation and drought stress (A); only defoliation (B); only drought stress (C); control (D). Note: The yellow line in the figure is equal to 30 cm.
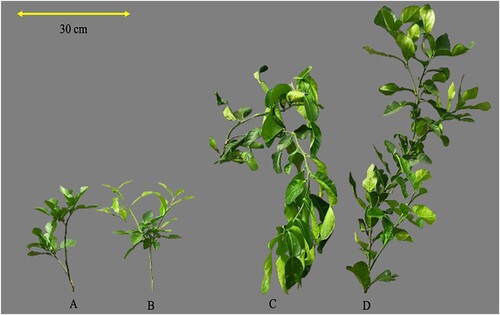
Figure 3. The leaves drop occurrence leaving several old leaves on undefoliated kaffir lime seedlings during the post-drought stress period (4 WATs): the percentage of drop and old leaves (A) and the number and weight of old leaves (B). Note: Two compared seedlings experiencing leaf drop: drought stress (C); and control (D). Mean values above the bar inside the right chart followed by similar alphabet are not significantly different based on the Duncan Multiple Range Test at α = 0.05.
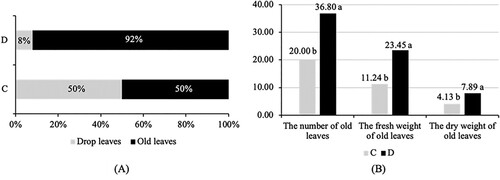
Table 1. Flushing characteristics of kaffir lime subjected to defoliation and drought condition.
Figure 4. The proportion of leaf and branch in newly emerged flush at 4 WATS. Note: Four compared treatments: defoliation and drought stress (A); only defoliation (B); only drought stress (C); control (D).
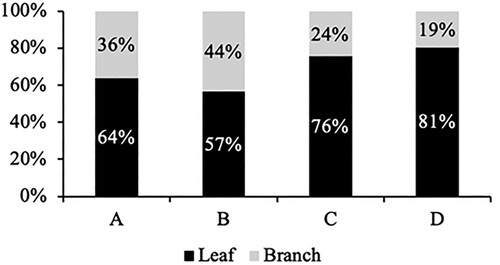
Table 2. Individual leaf size of kaffir lime subjected to defoliation and drought condition.
Table 3. Leaf production of kaffir lime subjected to defoliation and drought condition.
Table 4. Physiological properties of kaffir lime subjected to defoliation and drought condition.
Data availability statement
The data in the present finding are available from the corresponding author [RB] upon reasonable request.