Figures & data
Figure 1. Isolation of the fll2 mutant. (a) Schematic representation of the structure of the AtFLL2 gene, positions of T-DNA insertions in the SALK_049453 and SALK_044478 mutants, and sites of PCR primers. Exons are shown by boxes, in which the coding regions and untranslated regions are indicated by large open boxes and small shaded boxes, respectively. Regions corresponding to the TPR motifs are shown by open green boxes. (b) Detection of the transcripts in the mutant lines. FLL2 and UBC indicate the results of RT-PCR for the WT and mutant lines using the primers for the AtFLL2 and UBC genes, respectively. Numbers 1 to 3 indicate WT, SALK_049453, and SALK_044478, respectively. The UBC gene (At5g25760) was used as a control
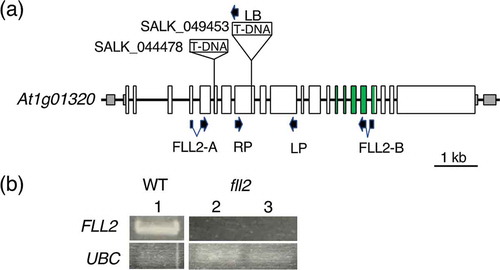
Figure 2. Characteristics of the fll2 mutant during the vegetative growth stage. (a) Features of wild-type (WT) and fll2 mutant plants (fll2) at 25 DAS. The left panels show whole plants. The right panels show the individual leaves and stems of plants. Scale bar = 1 cm. (b) Size of leaves of the fll2 mutant and WT at 21 DAS (n = 20). An asterisk indicates the value with significant differences (P < 0.05). The error bars represent the means ± SDs. (c) Time course analysis of the total weight of fresh leaves between 9 and 21 DAS. (d) The amount of chlorophyll a + b in green leaves at 21 DAS (n = 17 (WT) and 20 (fll2)). WT, wild type; fll2, fll2 mutant. The single and double asterisks indicate mean values with significant differences (P < 0.05 and P < 0.01, respectively). The error bars represent the means ± SDs
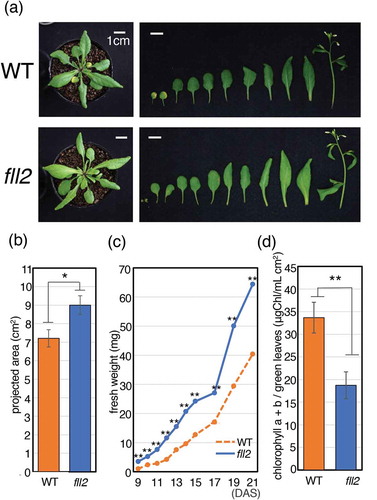
Figure 3. Features of the fll2 mutant and the wild-type plants after bolting. (a) Timing of bolting for the fll2 mutant and wild-type plants. The ratio of plants for which a bolting event occurred is shown (n = 15). (b) Morphology of a representative flower. Scale bar = 0.1 cm. WT, wild-type plant; fll2, fll2 mutant. (c) Features of seeds of the wild-type plants and the fll2 mutant. Scale bars = 0.5 mm. (d) Number of siliques of the fll2 mutant (fll2) and wild-type (WT) plants (n = 10 and 7, respectively). (e) Number of seeds in a silique. Mean values of the siliques of the fll2 mutant (fll2) and the wild-type (WT) plants are shown (n = 125 and 70, respectively). (f) Seed sizes of the fll2 mutant and the wild-type plants. Each seed size was estimated as the mean value obtained by measuring the areas of seeds in the images. For this analysis, 109 and 100 seeds of the fll2 mutant and the wild-type plants were used, respectively. Means that differed significantly are indicated by double asterisks (P < 0.01). The error bars represent the means ± SDs. (g) Weight of 100 seeds of the fll2 mutant and WT (n = 3). The error bars represent the means ± SDs
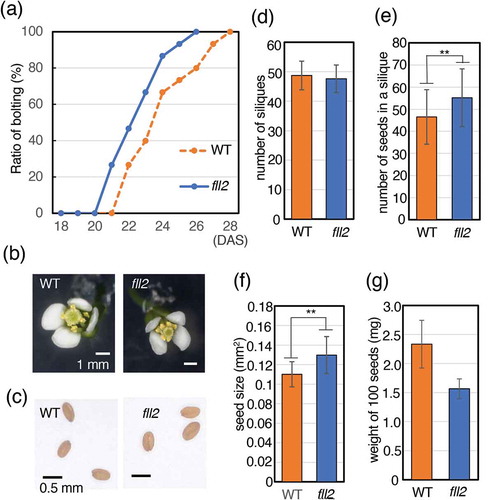
Figure 4. Sugar contents in leaves of the fll2 mutant. Leaves were harvested in the daytime. (a) Sucrose contents, (b) fructose contents, and (c) glucose contents in the leaves at 14, 21, 28, and 38 DAS of the fll2 mutant (fll2) and wild-type (WT) plants (n = 3). Means that differed significantly are indicated by asterisks (P < 0.05) or double asterisks (P < 0.01). The error bars represent the means ± SDs
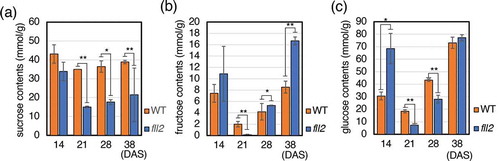
Figure 5. Accumulation of assimilated starch. (a) Iodine staining of the leaves of the fll2 mutant (fll2) and the wild-type (WT) plants at 14 DAS 8 h after the light period started. Scale bars = 1 cm. (b) Time course representation of the amount of assimilated starch in the leaves of the fll2 mutant (fll2) and the wild-type (WT) plants (n = 3) at 14, 21, 28, and 38 DAS. The leaves were harvested at 7 h after the light period started. Means that differed significantly are indicated by asterisks (P < 0.05) or double asterisks (P < 0.01). The error bars represent the means ± SDs
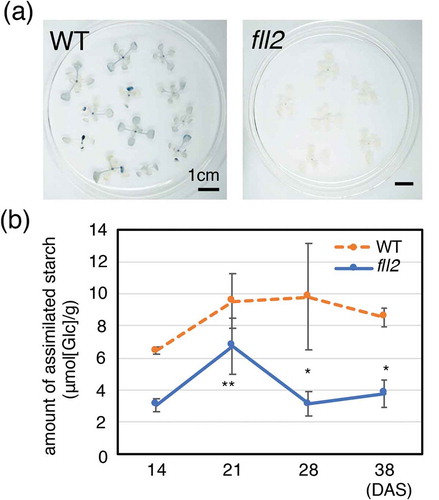
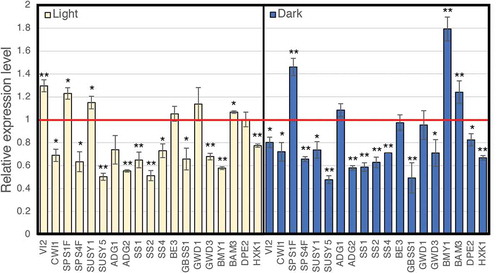
Figure 6. Real-time RT-PCR analysis of the expression of the representative genes involved in the production of sugars and starch. Total RNA prepared from leaves, which were harvested at 8 h after the light period started (left panel) and at 6 h after the dark period started (right panel), was used for real-time RT-PCR analysis. The expression of representative genes is shown relative to that of the wild type, which is set as 1. Each gene name is indicated by a simplified representation as follows: ADG1, ADP-glucose pyrophosphorylase small subunit 1 (At5g48300); ADG2, ADP-glucose pyrophosphorylase large subunit 1 (At5g19220); SS1, starch synthase 1 (At5g24300); SS2, starch synthase 2 (At3g01180); SS4, starch synthase 4 (At4g18240); BE3, starch branching enzyme (At2g36390); GBSS1, granule-bound starch synthase 1 (At1g32900); GWD1, chloroplastic α-glucan water dikinase 1 (At1g10760); GWD3, chloroplastic phosphoglucan water dikinase (At5g26570); BMY1, β-amylase (At4g15210); BAM3, β-amylase 3 (At4g17090); DPE2, 4-α-glucanotransferase 2 (At2g40840); HXK1, hexokinase 1 (At4g29130); VI2, vacuolar invertase (At1g12240); CWI1, cell wall invertase 1 (At3g13790); SPSF1, sucrose phosphate synthase 1 F (At5g20280); SPSF4, sucrose phosphate synthase 4 F (At4g10120); SUS1, sucrose synthase 1 (At5gG20830); and SUS5, sucrose synthase 5 (At5g37180). The transcript of ubiquitin-conjugating enzyme 21 (UBC; AT5g25760) was used as a control. The error bars represent the means ± SDs (n = 3). The means that differed significantly from the wild-type plant are indicated by asterisks (P < 0.05) or double asterisks (P < 0.01)