
Figures & data
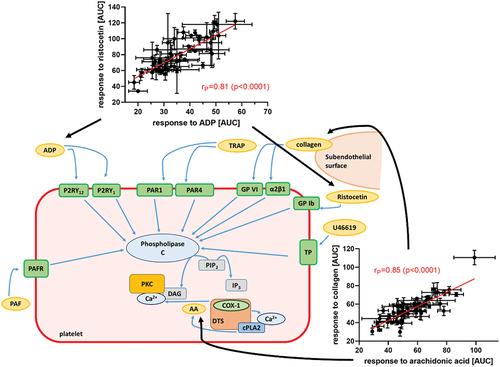
Figure 1. Platelet activation pathways of the different platelet triggers and antiplatelet compounds used. Tested inducers are depicted as yellow ellipses while tested antiplatelet drugs as red ellipses. Abbreviations: AA: arachidonic acid; ADP: adenosine diphosphate; ASA: acetylsalicylic acid; COX-1: cyclooxygenase-1; cPLA2: cytosolic phospholipase A2; DTS: dense tubular system; Gi: G protein α subunit i; GP Ib: glycoprotein Ib; GP VI: glycoprotein VI; Gq: G protein α subunit q; IP3: inositol triphosphate, P2RY1, P2RY12: two receptors for ADP, PAF: platelet activating factor; PAFR: PAF receptor; PAR1: protease activated receptor 1; PIP2: phosphatidylinositol 4,5-biphosphate; PKC: protein kinase C; TP: thromboxane receptor, TRAP: thrombin receptor-activating peptide; TXA2: thromboxane A2; α2β1: integrin α2β1.
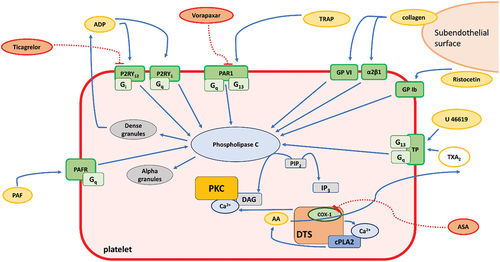
Figure 2. The strongest associations between platelet aggregatory responses to inducers. (a): arachidonic acid (200 μM) and collagen (1 μg/mL), (d): arachidonic acid (200 μM) and U-46619 (80 nM), (c): arachidonic acid (200 μM) and TRAP (10 μM), (b): ADP (5 μM) and ristocetin (400 μM), (e): collagen (1 μg/mL) and acetylsalicylic acid (70 μM) + collagen (1 μg/mL), (f): ticagrelor 500 nM + ADP (5 μM) and vorapaxar (5 μM) and TRAP (10 μM). AUC: area under the curve measured by impedance aggregometry.
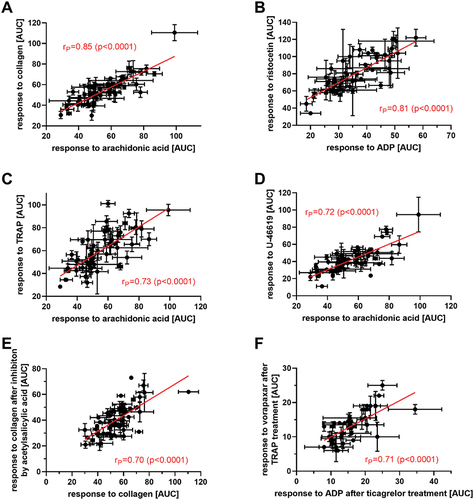
Table I. Relationships between responses to different aggregation inducers.
Table II. Relationships between responses to different platelet aggregation inhibitors and platelet aggregation inducers.