Figures & data
Figure 1. Differential ultracentrifugation schemes for isolating exosomes from fresh or frozen plasma with series of measurement by TEM, NTA and WB. *T0 samples were measured for exosomal characteristics immediately after isolation without storage.
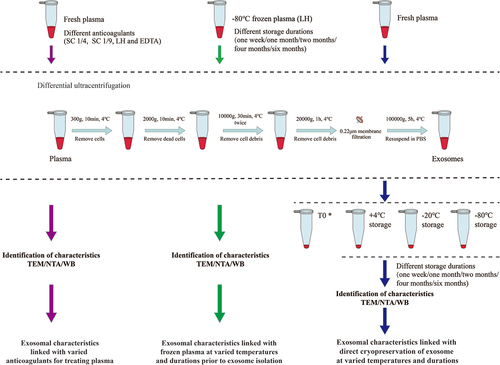
Figure 2. Characteristics of plasma-derived exosomes reserved with varied anticoagulants. (a) Morphological features was observed by TEM. (b) The concentration of exosome particles was analyzed by NTA. (c) Size distribution of exosomes was detected by NTA. (d) Particle peak diameter of exosomes was determined by NTA. (e) Protein content of Exosome positve markers (TSG101, CD63 and CD9) and negative marker (Calnexin) were measured by WB. One-way ANOVA test was used for the means comparison among multiple groups followed by LSD for comparison between two groups. Data were expressed as mean ± SD (n = 3 per group). *p <0 .05, **p <0 .01.
Table 1. Particles concentrations and peak diameter of exosomes derived from plasma pretreated with anticoagulants
Figure 3. Transmission electron microscopic examination of exosomes isolated from plasma at different storage conditions. (a) Fresh exosomes without storage. (b–d) One-week stored exosomes with direct cryopreservationat 4°C, −20°C and −80°C, respectively. (e) One-week stored exosomes isolated from −80°C frozen plasma. (f–h) One-month stored exosomes with direct cryopreservation at 4°C, −20°C and −80°C, respectively. (i) One-month stored exosomes isolated from frozen −80°C plasma. (j–l) Two-month stored exosomes with direct cryopreservation at 4°C, −20°C and −80°C, respectively. (m) Two-month stored exosomes isolated from −80°C plasma. (n–p) Six-month stored exosomes with direct cryopreservation at 4°C, −20°C and −80°C, respectively. (q) Six-month stored exosomes isolated from −80°C frozen plasma. Direct mag: 40 000 ×, HV = 200.0 kV.
Figure 4. NTA analysis for particle size and concentrations under different storage temperatures and durations. (a – d) Concentrations and sizes distribution of the plasma exosomes after storage for one week, one month, four months and six months, respectively. The y-axis represents concentrations of particles per ml and the x-axis shows their sizes. (e) Concentration of particles in exosomes under different storage temperatures and durations by NTA. (f, g) Particle peak diameter of exosomes under different storage temperatures and durations by NTA. Data were analyzed by one-way ANOVA test for multiple groups comparison followed by LSD for further intergroup. Data were expressed as mean ± SD (n = 3 per group). T0 stands for exosomes from fresh plasma.
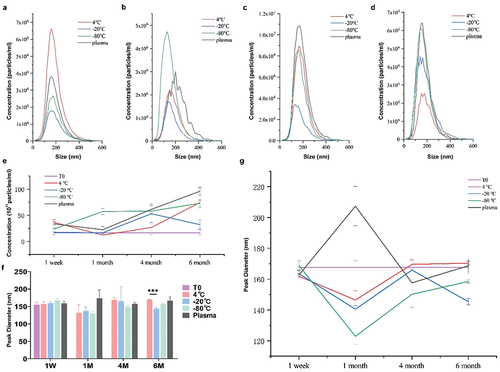
Table 2. Concentrations and diameter of plasma-derived exosomes.
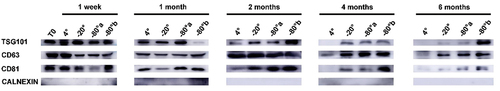
Figure 5. Western blot analysis for protein biomarkers of exosomes stored under different temperatures and durations. Exosome surface protens included (TSG101, CD63, CD81) as positive biomarkers and Calnexin as negative markers. T0 stands for exosomes from fresh plasma samples. −80°a stands for exosomes with direct cryopreservation at −80°C; −80°b stands for exosomes isolated from frozen plasma but with no further frozen storage.