
Figures & data
Figure 1. Chromosome location analysis of banana (Musa acuminata) 4CL family members. The scale on the left is for the length of the chromosome.
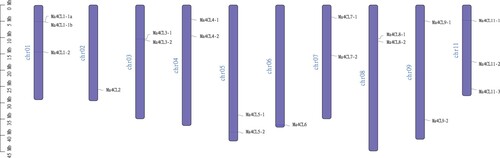
Table 1. Basic information about the members of the banana 4CL protein family.
Table 2. Prediction of 4CL glycosylation sites in banana.
Figure 2. Gene structure distribution of banana 4CL family members. The different colors represent the different structures.
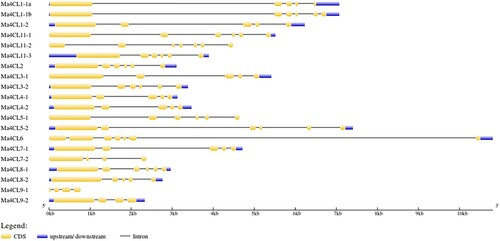
Figure 3. Conserved motifs distribution of banana 4CL family members. The different colors represent the different motifs.
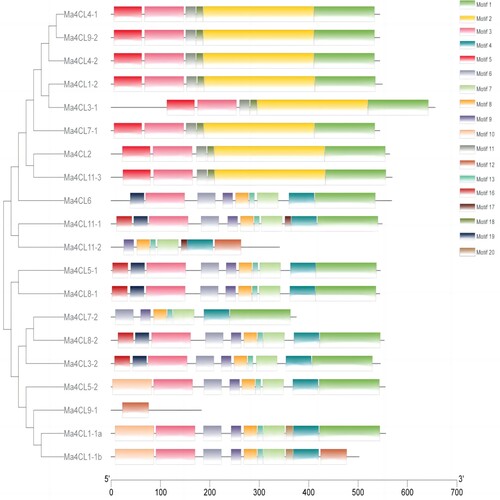
Table 3. Sequence and functional annotation of conserved motifs of banana 4CL.
Figure 4. Protein-protein interactions (PPI) of banana 4CL family members. Line thickness indicates the strength of data support.
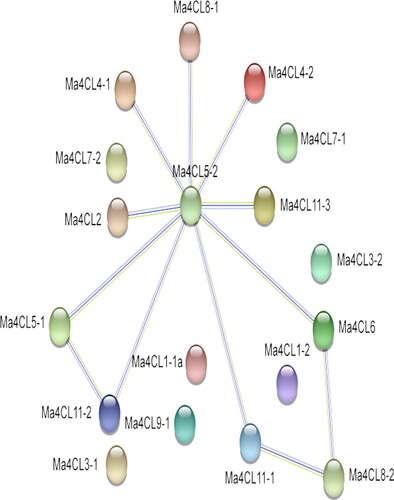
Figure 5. Analysis of specific expression of banana 4CL family under different low temperature treatments. Darker colors indicate higher expressions, while lighter colors indicate lower expressions. “L” represnt the low temperature. L0, L4, L13, L28: treated at 0°C, 4°C, 13°C, 28°C, respectively
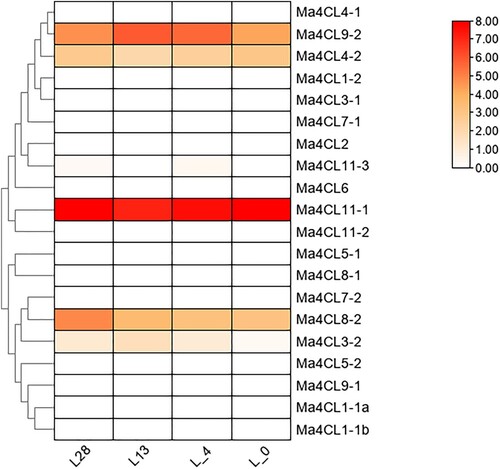
Figure 6. The phylogenetic analysis of 4CL gene family between Musa acuminata, Arabidopsis thaliana, Oryza sativa. L, Zea mays. L and Sorghum bicolor (L.) Moench. The phylogenetic tree was constructed by MEGA7.0 with the Neighbourhood Joining (NJ) method. Different clades were painted with different colors.
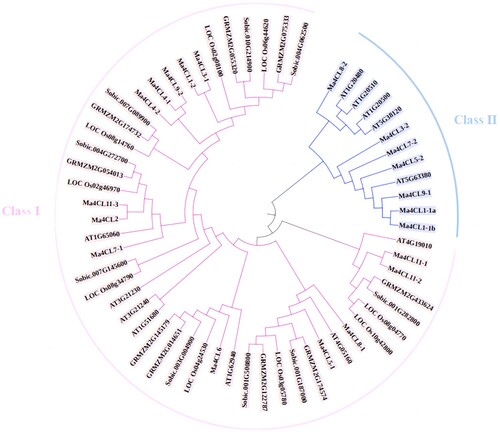
Figure 7. Interspecies collinear analysis of 4CL genes in the whole genome of Musa acuminata, Musa balbisiana and Musa itinerans. The green represents the Musa balbisiana, the orange represents the Musa acuminata, and the blue represents the Musa itinerans. The red curve between chromosomes represents the gene pairs between banana 4CLs.
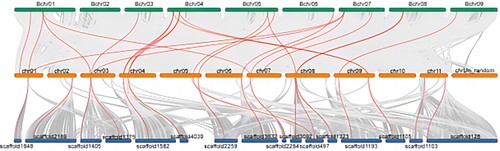
Table 4. Colinear pairs of the 4CL gene family in banana.