
Figures & data
Figure 1. Inductive research process using machine learning with an out-of-sample test.
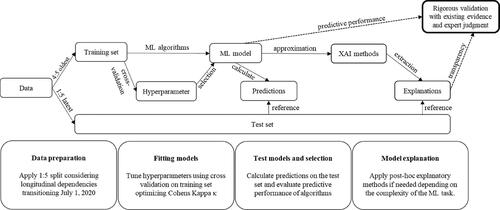
Figure 2. Acquired longitudinal data for historical voluntary turnover. The direct impact (black) is investigated in this study.
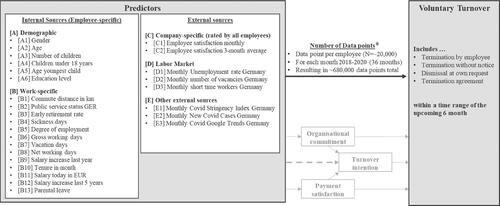
Table 1. Descriptive statistical overview of available variables in the acquired dataset.
Table 2. Selected ML algorithms with their primary advantage according to the transparency vs. performance trade-off.
Table 3. Predictive performance measures of all used algorithms on test data.
Table 4. Confusion matrices on test data of random forest (highest predictive performance overall) and classification tree (most successful alternative algorithm with advantage transparency).
Figure 3. Predictive performance vs. transparency trade-off on test data (confidence interval 0.95).
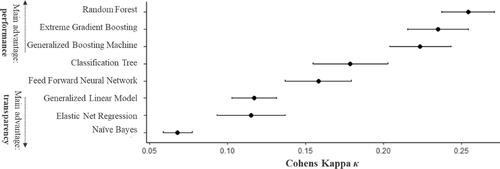
Figure 4. Permutated feature importance for the top 20 predictors (relative change in performance, confidence interval 0.95).
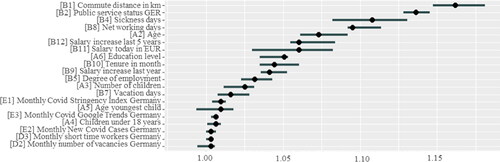
Figure 5. Accumulated local effect plots for the top 12 predictors according to permutated feature importance. Grey = all employees, blue = men, red = women.
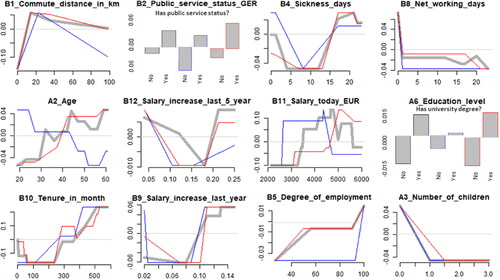
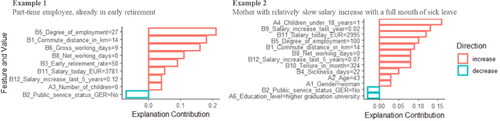
Figure 6. Top-10 SHAP values for two employees successfully predicted turnover candidates (true-positive).
Data availability statement
Data available on request due to privacy/ethical restrictions.