
Figures & data
Table 1. Baseline characteristics of 101 participants in this study.
Table 2. Summary statistics of PM2.5 compositions, O3 and BDNF promoter methylation levels in this panel study.
Table 3. The percent changes of BDNF promoter methylation levels associated with each interquartile range increase of PM2.5 compositions and O3..
Figure 1. The joint and individual effects of PM2.5 compositions and O3 on BDNF promoter methylation using BKMR models.
(a) The joint effects (percent change, 95% CI) of air pollution mixtures on BDNF promoter methylation using the BKMR model. This plot shows the percent change in each CpG methylation level when all pollutants are fixed at a certain percentile compared to their lowest level. (b) Individual pollutant effects (percent change, 95% CI) on BDNF promoter methylation when other pollutants are fixed at a specific quantile (25th, 50th, 75th). Models were adjusted for sex, age, education, physical, occupation, smoking, cardiovascular disease, respiratory diseases, and diabetes.
Abbreviations: SO42-, sulfate; NO3-, nitrate; NH4+, ammonium; OM, organic matter; BC, black carbon; PM2.5, particulate matter ≤2.5 μm in diameter; O3, ozone; CI, confidence interval; BDNF, Brain-derived neurotrophic factor.
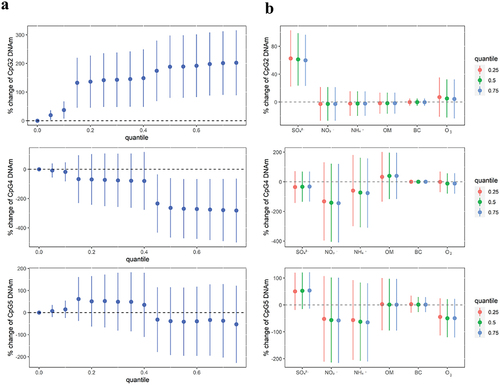
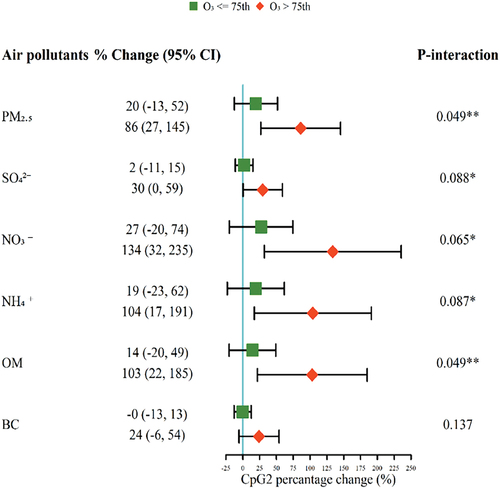
Figure 2. The percent changes of BDNF promoter methylation levels (CpG2) associated with each interquartile range increase of PM2.5 compositions (μg/m3) in different O3 exposure levels.
* P-interaction <0.1. ** P-interaction <0.05. Models were adjusted for sex, age, education, physical, occupation, smoking, cardiovascular disease, respiratory diseases, and diabetes.
Abbreviations: SO42-, sulfate; NO3-, nitrate; NH4+, ammonium; OM, organic matter; BC, black carbon; PM2.5, particulate matter ≤2.5 μm in diameter; O3, ozone; CI, confidence interval; BDNF, Brain-derived neurotrophic factor.
Supplemental material