
Figures & data
Figure 1. Illustration of how the test specimens were printed in the AM machine, where is the building direction, i.e. the normal to the building platform.
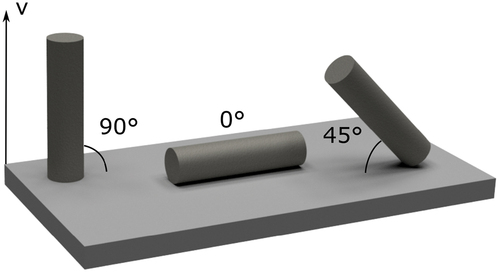
Figure 2. Utilised specimen geometries for a) C, b)
C,
C and
C creep, c) tensile, d) LCF and e) TMF tests.
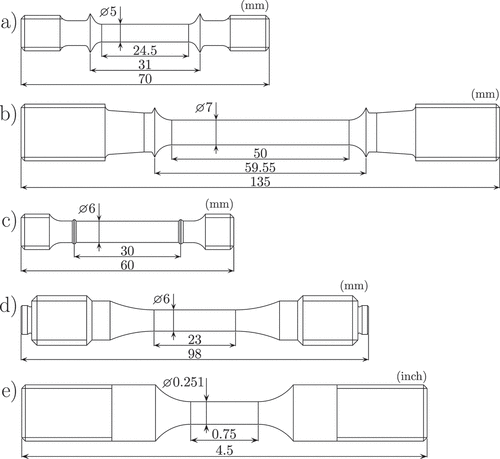
Table 1. Summary of the performed creep tests.
Figure 3. Experimental creep strain vs. time at a) C, b)
C, c)
C and d)
C.
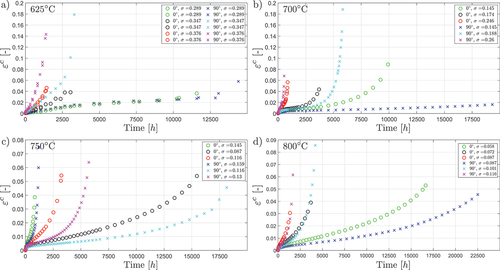
Figure 4. Strain rate vs. applied strain in the monotonic tensile tests.
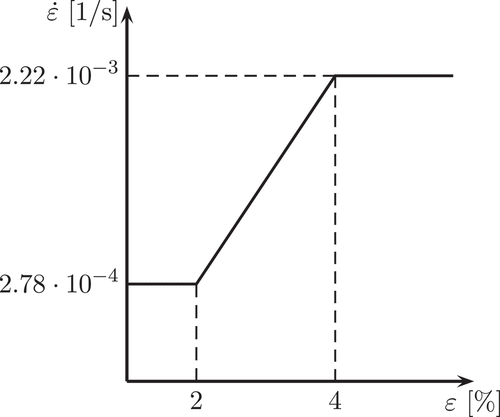
Figure 5. Experimental true stress () vs. true strain (
) for the monotonic tensile tests at a)
C, b)
C and c)
C.
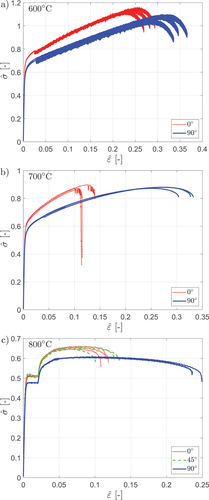
Figure 6. The experimental minimum creep rate vs. stress from the creep tests at C, a fitted Norton expression for the
and
specimens, respectively, and the obtained strain rates and stress plateaus from the tensile tests.
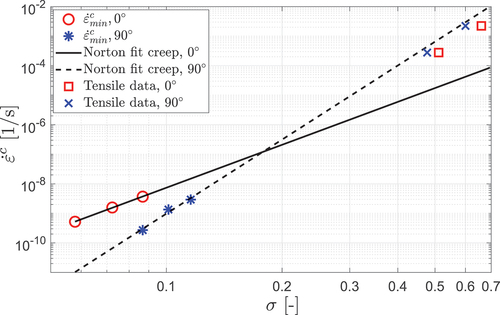
Table 2. Summary of the performed LCF tests at C.
Figure 7. Experimental mid-life hysteresis loops for the LCF tests at C for a)
and b)
.
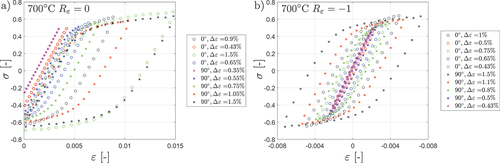
Figure 8. Loading sequence for the temperature and mechanical strain during a) in-phase and b) out-of-phase TMF loading.
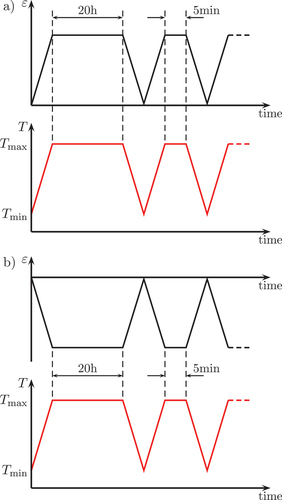
Figure 9. Experimental stress vs. mechanical strain for the TMF tests with C, showing cycle 1, 2 and the mid-life cycle for test a) IP800:0:0.4, b) OP800:0:0.6, c) IP800:90:0.3, and d) OP800:90:0.4.
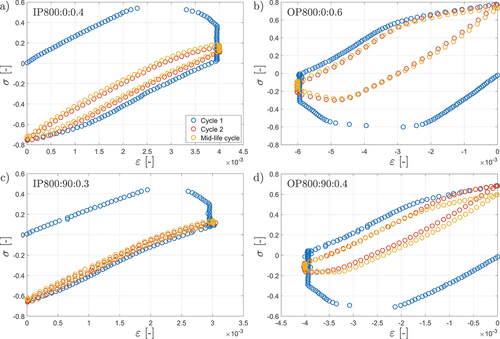
Table 3. Summary of the performed TMF tests with C.
Figure 10. Experimental inelastic strain rate vs. stress from the hold-times during the first cycle and in the mid-life cycle for IP and OP TMF tests with C and OP TMF tests with
C.
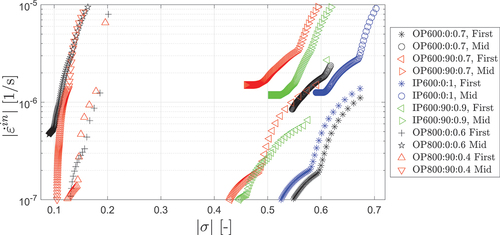
Figure 11. Schematic overview of the cycle jumping procedure, where the initial virgin parameters are changed after the first onloading and hold-time to mid-life parameters.
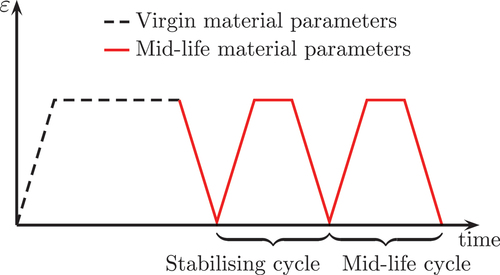
Figure 12. Illustration of the stress update procedure, where the elastic trial stress is updated with a creep corrector. If after the creep corrector, the stress is updated with a plastic corrector to obtain
.
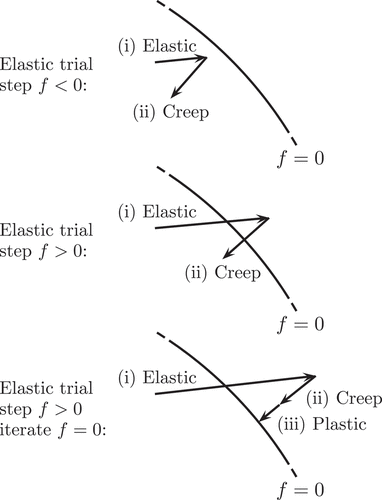
Figure 13. Illustration of how the saturated backstress was based on the accumulated creep strain in the beginning of the secondary creep stage and the double-Norton terms evaluated from the minimum creep strain rates.
Table 4. Summary of which tests the material parameters were extracted from.
Figure 14. The obtained parameters for the rate-dependent terms and the temperature interpolation for a) ,
and
, and b)
,
and
.
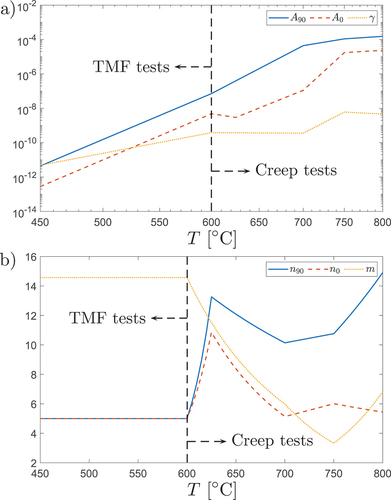
Table 5. Summary of the parameters that are dependent on instant and maximum temperature.
Figure 15. Experimental and simulated creep response for a) C, b) zoomed in to strains up to 1% and the first 2000 hours for
C, c)
C, d) zoomed in
C, e)
C, f) zoomed in
C, g)
C and h) zoomed in
C.
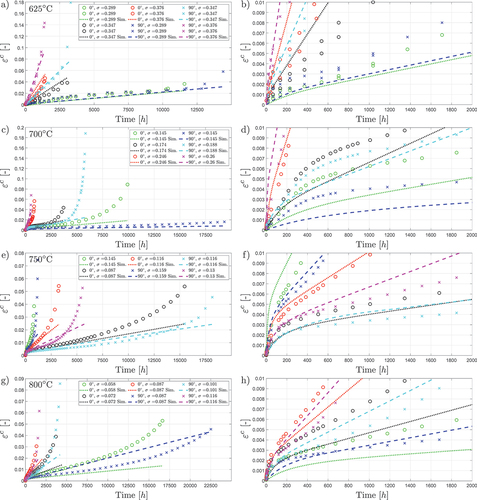
Figure 16. Experimental and simulated stress vs. mechanical strain for the TMF tests with C, showing cycle 1, 2 and the mid-life cycle for the experiments and cycle 1 and mid-life for the simulation without the aging term, for test a) IP800:0:0.4, b) OP800:0:0.6, c) IP800:90:0.3, and d) OP800:90:0.4.
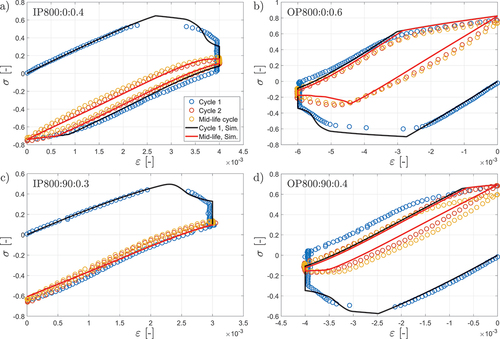
Figure 17. Experimental and simulated stress vs. mechanical strain for IP TMF tests with C for
specimen with
a)
, b)
, c)
and d)
and
specimen with
e)
and f)
.
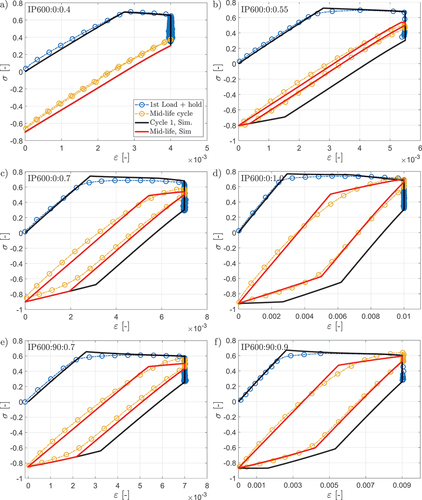
Figure 18. Experimental and simulated stress vs. mechanical strain for OP TMF tests with C for
specimen with
a)
and b)
and
specimen with
c)
and d)
.
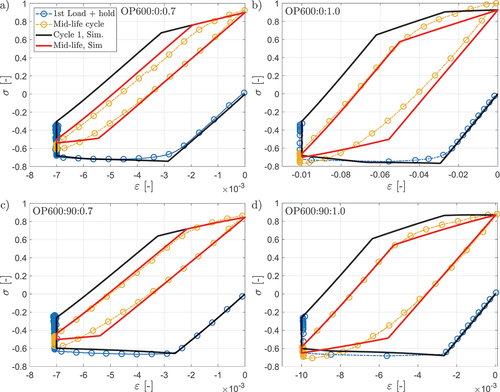
Figure 19. Experimental and simulated stress vs. mechanical strain for TMF tests with C, for a) IP TMF
specimen with
and b) OP TMF
specimen with
.
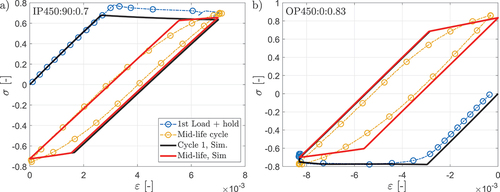
Figure 20. Experimental and simulated mid-life response of the LCF tests at C for
specimens with a)
and b)
and
specimens with c)
and d)
.
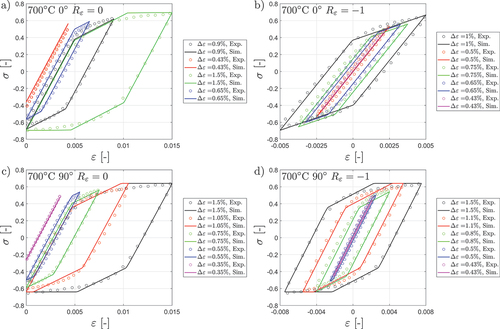
Figure 21. Simulated vs. experimental mid-life results for the TMF tests with up to
C and LCF tests at
C for a) maximum stress, b) minimum stress, and c) inelastic strain range.
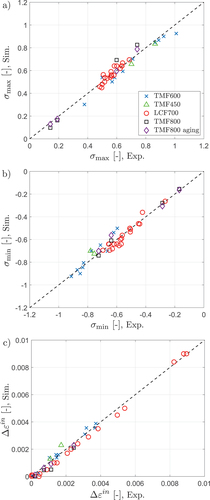
Figure 22. Experimental and simulated stress vs. mechanical strain for the TMF tests with C, showing cycle 1, 2 and the mid-life cycle for the experiments and cycle 1 and mid-life for the simulation with the aging term, for test a) IP800:0:0.4, b) OP800:0:0.6, c) IP800:90:0.3, and d) OP800:90:0.4.
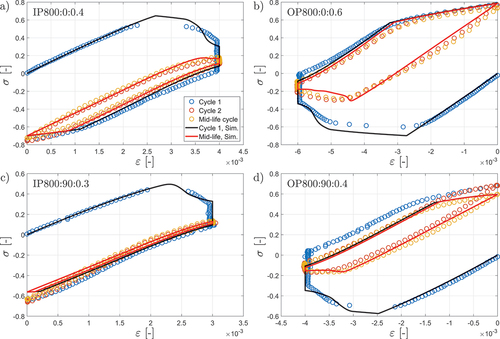
Table 6. between the experimental and simulated values of
,
and
for the TMF tests with
C with and without using an aging term
.
index_MHT.dvi
Download (347 KB)index_MHT.bbl
Download (12.5 KB)index_MHT.ps
Download (14.6 MB)Data availability statement
The data required to reproduce the results cannot be shared due to confidentiality with regard to the partner company intellectual properties.