Figures & data
Figure 1. Methodological flow chart of this study.
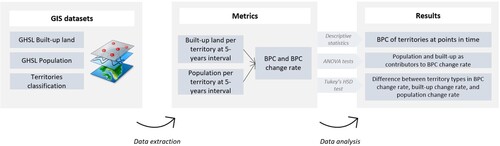
Figure 2. conceptual model of (a) relative urban land polarization, and (b) absolute urban land polarization. In both cases, in the starting year, BPC is lower on the urban side of the urban-rural gradient, and the difference increases over time (indicated by the arrows). Yet, while relative polarization is characterized by an increase in BPC in all territory classes, absolute polarization has changes in BPC in different directions of the urban-rural gradient.
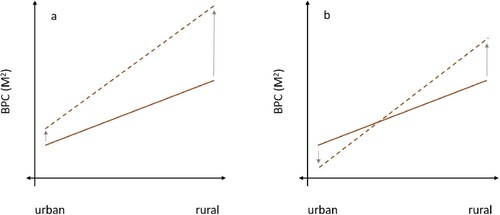
Table 1. Overview of data sources.
Figure 3. Classification of territories.
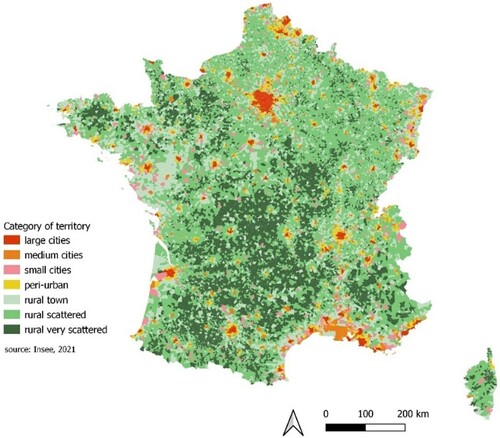
Table 2. Distribution of territories and 2020 population according to the classification of territories.
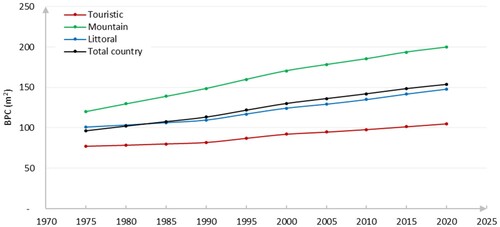
Figure 4. (a) Change in average BPC per class of territory 1975-2020. Representation of BPC change in square metres between 1975–2020 (b) for the overall country, and detail of class of territory for territories which experienced (c) a decrease in BPC, and (c) a large increase in BPC (> 200 m2) over the period.
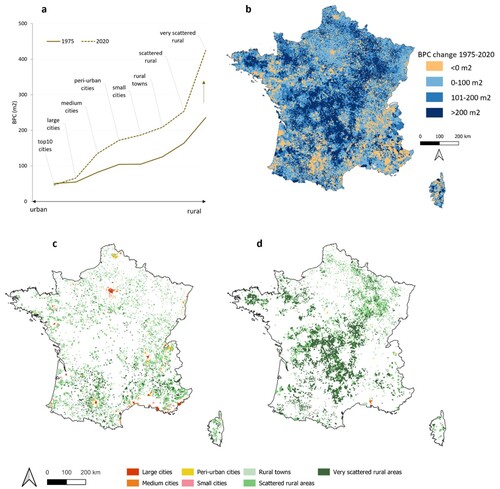
Table 3. Evolution of population, built-up land, and BPC 1975–2020 for the seven territory classes.
Figure 5. Evolution of (a) population and (b) built-up land by territory class 1975-2020.
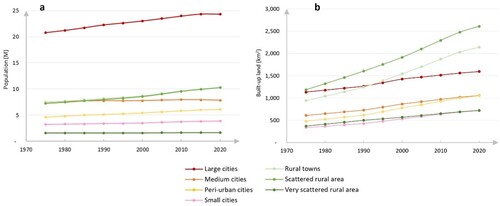
Figure 6. Evolution of average BPC per characteristic.