
Figures & data
Figure 1. A mining scene. (a) Complex scenes and heterogeneous composition; (b) large variation in shape, scale and spectrum.
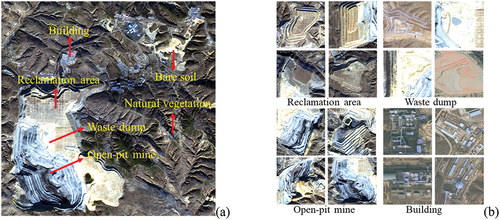
Figure 2. Flowchart of the proposed MFOCNN.
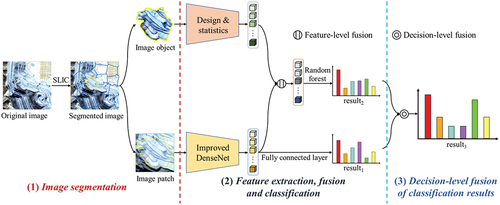
Figure 3. Image segmentation result. (a) Result of multi-scale segmentation, (b) result of SLIC, (c) and (d) image patches are too small or too large to effectively represent the image objects in existing OCNN method, (e) and (f) image patches can effectively represent the image objects.
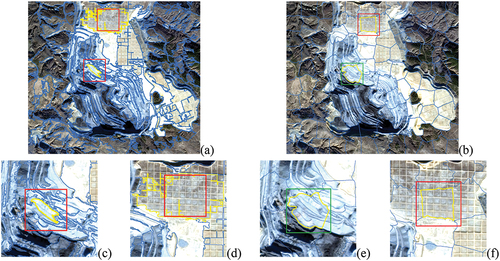
Figure 4. The structure of the improved DenseNet.
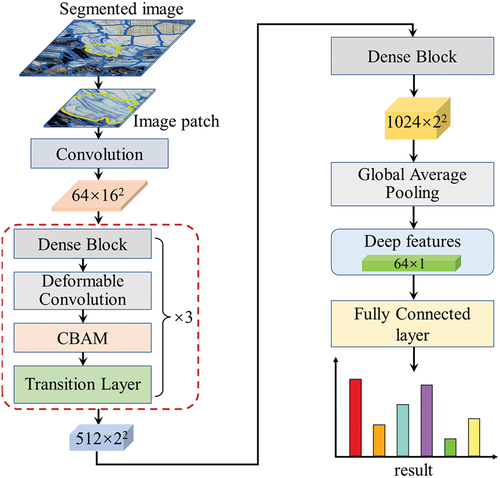
Figure 5. The structure of deformable convolution.
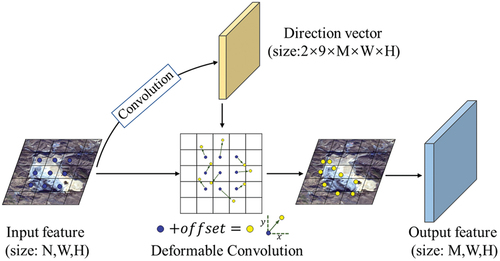
Figure 6. The structure of CBAM.
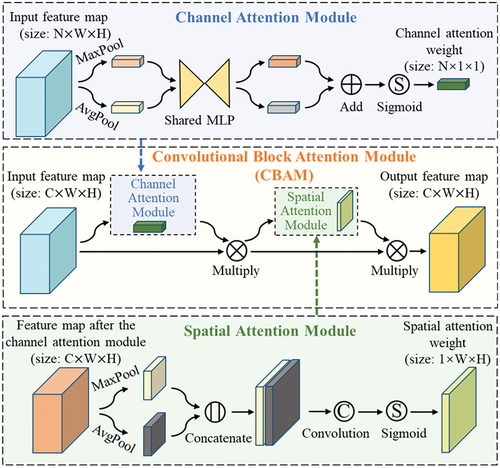
Table 1. The handcrafted features.
Figure 7. The study area.
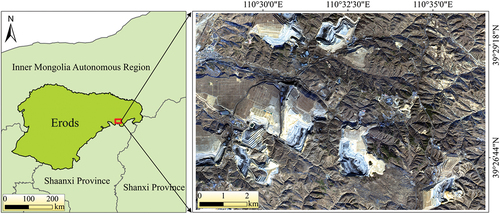
Table 2. Number of samples.
Table 3. The hyperparameters of MFOCNN.
Figure 8. Classification visualization results of different comparison methods.
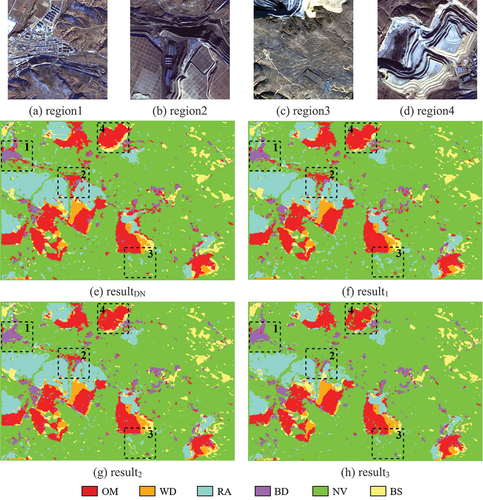
Table 4. Quantitative evaluation results of different comparison methods.
Figure 9. Classification visualization results based on different segmentation algorithms.
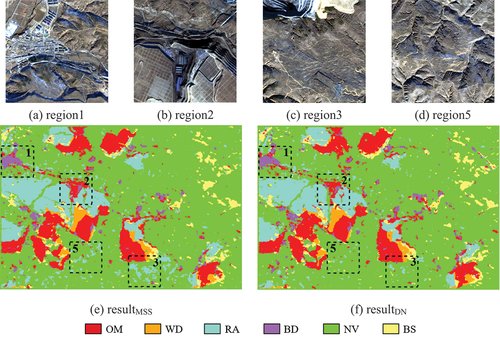
Table 5. Quantitative evaluation results based on different segmentation algorithms.
Figure 10. Classification visualization results based on different classification networks.
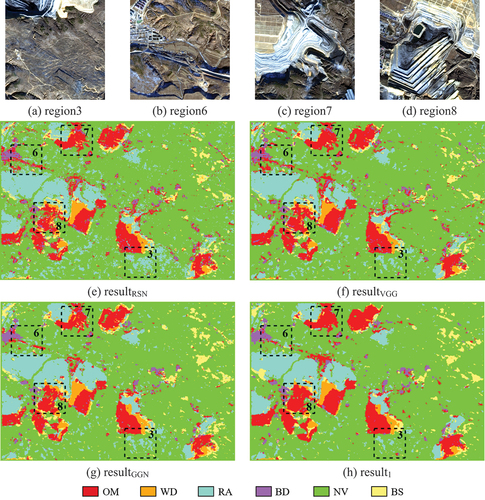
Table 6. Quantitative evaluation results based on different classification networks.
Figure 11. Classification visualization results based on different semantic segmentation networks.
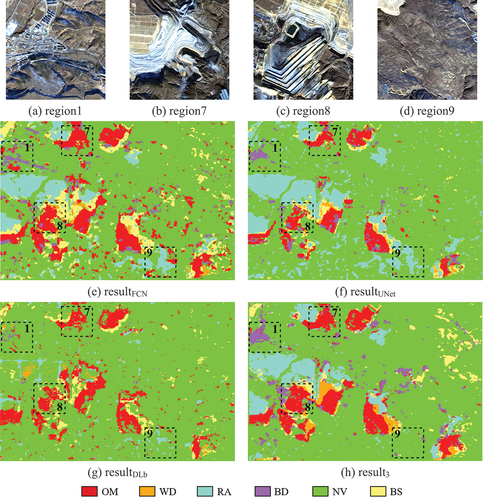
Table 7. Quantitative evaluation results based on different semantic segmentation networks.
Figure 12. The and
of different n_segments.
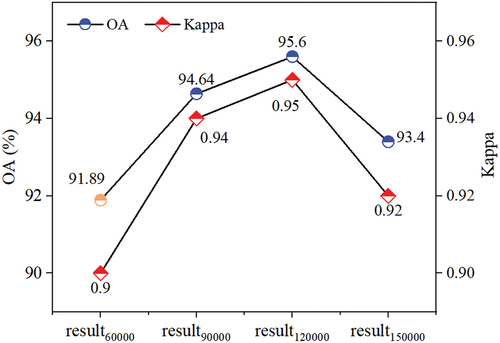
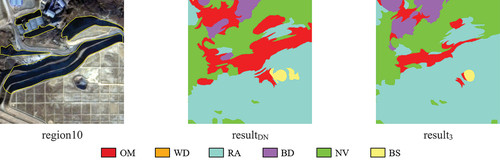
Figure 13. Classification results in shadow areas in resultDN and result3, the yellow circled area in region 10 is shadow.
Data availability statement
The remote sensing image used in this study can be acquired from the following link: https://figshare.com/s/0cd166e71ac14e73a0bc. The codes using python language can be founded from the following link: https://figshare.com/s/b1d5079b9859321dcf88.