
Figures & data
Table 1. Notation for description of energy consumption function.
Figure 1. Example of traffic conditions becoming congested after reaching charging station.
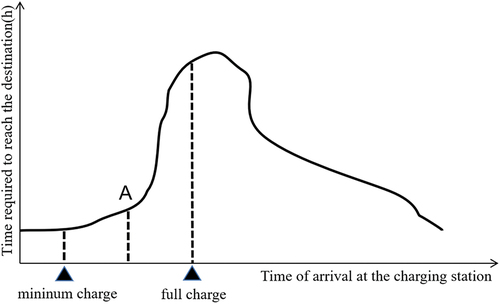
Figure 2. Example of traffic conditions remaining unchanged after reaching charging station.
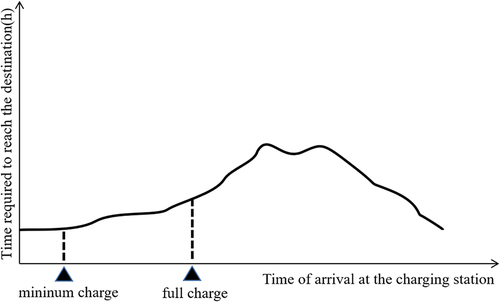
Figure 3. Example of traffic conditions becoming smooth after reaching charging station.
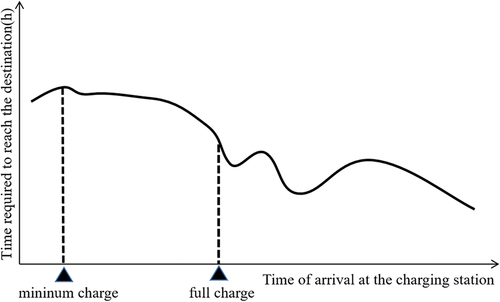
Figure 4. Piecewise approximation of charging curve.
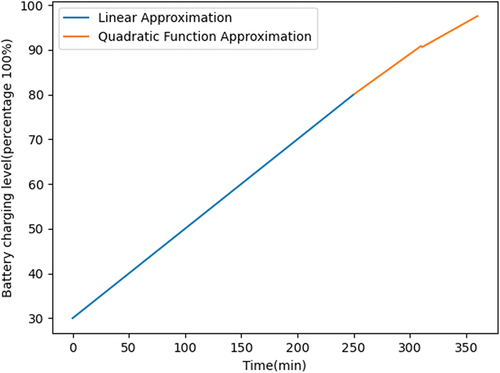
Figure 5. Schematic diagram of a simple road network.
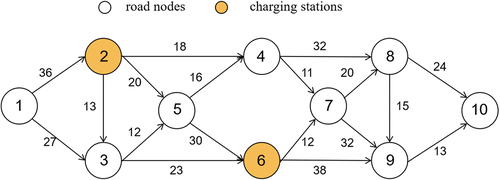
Table 2. Example of chromosome structure.
Figure 6. Charging navigation flow chart.
Figure 7. Schematic diagram of road network structure.
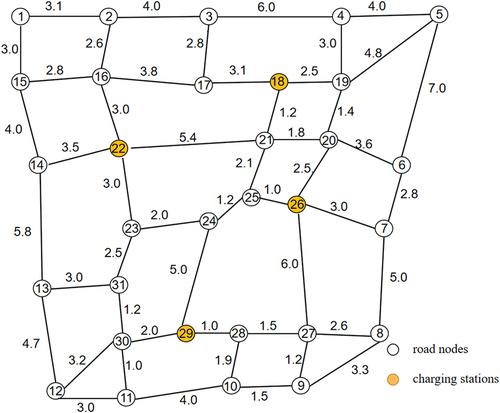
Table 3. Charging station properties.
Table 4. Parameters of Tesla Mode3.
Figure 8. Changes in travel time and remaining SoC.
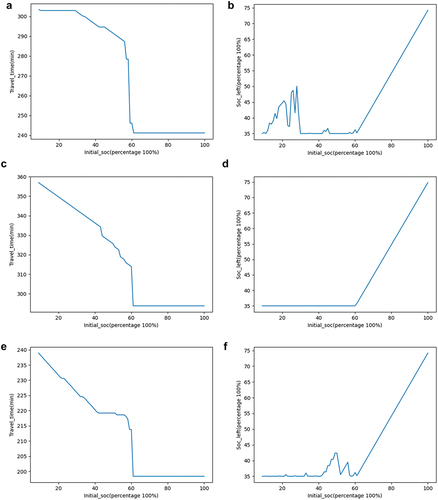
Table 5. Components of travel time.
Figure 9. Travel time curve with dynamic and static traffic condition.
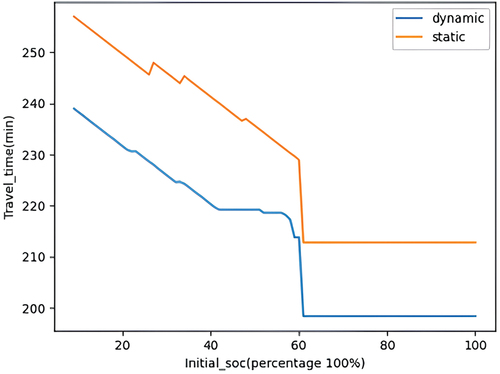
Figure 10. Planned routes under different traffic condition characteristics.
Table 6. Comparison of results considering traffic condition changes.
Figure 11. Convergence graph of genetic algorithm.
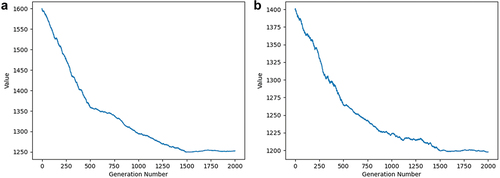
Figure 12. The comparison of running time.
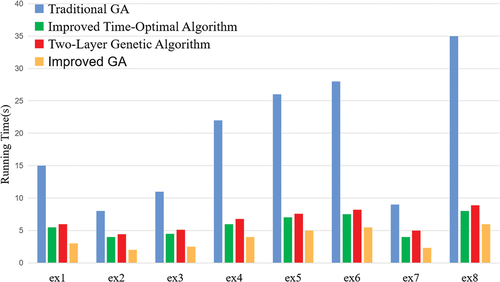
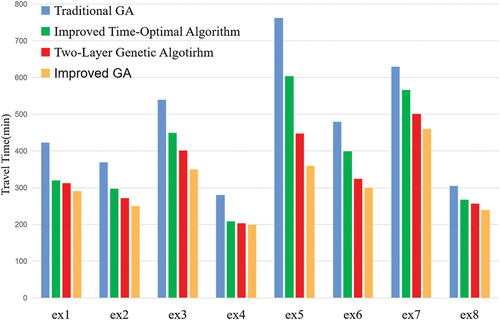
Figure 13. The comparison of travel time.
Data availability statement
The data that support the findings of this study are available from the corresponding author, [[email protected]], upon reasonable request.