
Figures & data
Figure 1. The study area in Vorkuta, Russia.
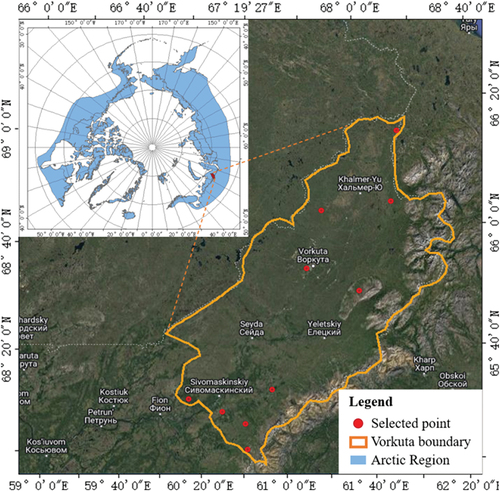
Figure 2. The NDVI time series during 2003–2021 of the selected ten vegetation points.
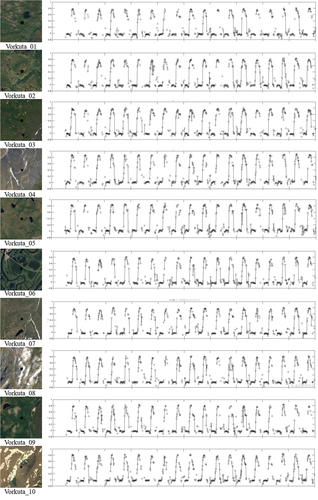
Figure 3. “Year-day” coordinate system construction.
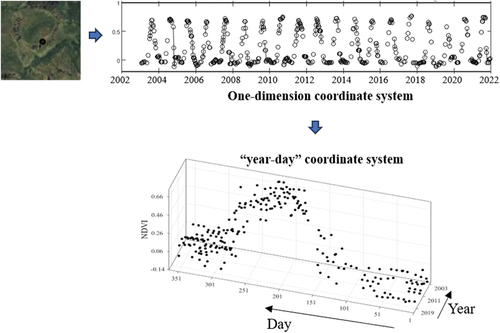
Figure 4. Seasonal-scale and month-scale NDVI gradient calculation between different years.
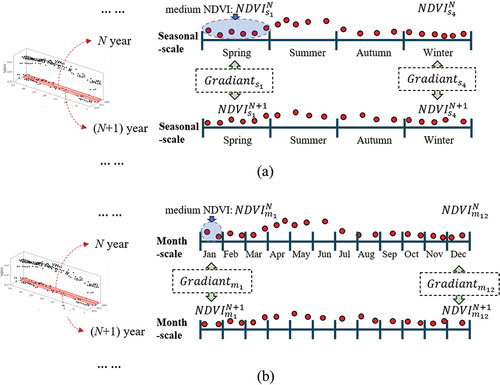
Figure 5. Change year determination by OSTU threshold and intersection of two change_year sets.
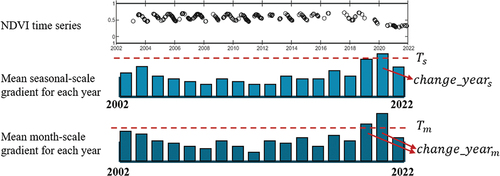
Figure 6. The process of inter-annual interpolation.
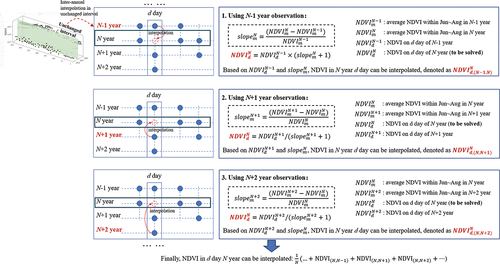
Figure 7. Two assumptions for evaluating the uncertainty of each observation.
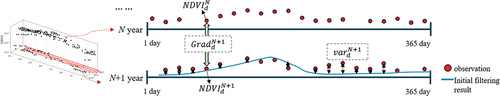
Figure 8. The pipeline of the proposed TSR-PT method for NDVI reconstruction.
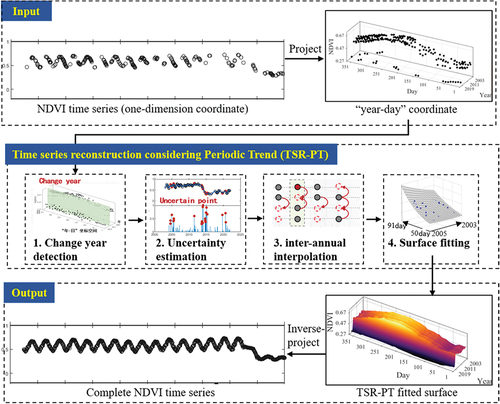
Figure 9. High resolution visual examination of the Vorkuta_01 during 2003–2021.
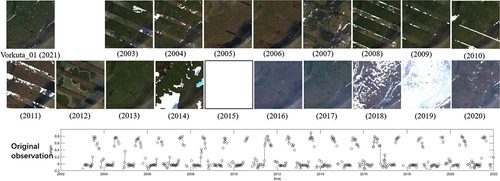
Figure 10. The synthetic reference and synthetic time series with different degree of cloud mask.
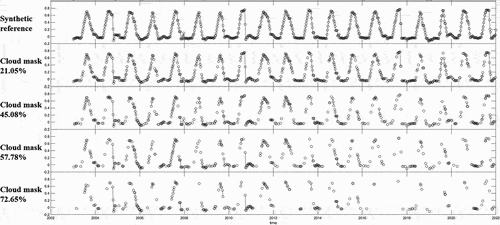
Figure 11. Observation uncertainty estimation for different cloud mask situation.
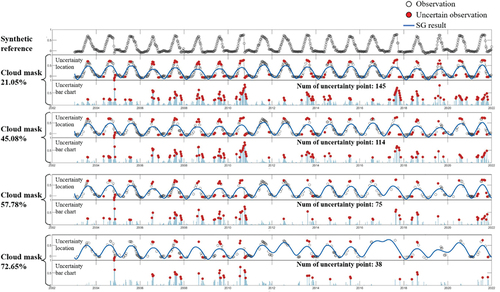
Figure 12. Comparison of the NDVI time series reconstruction result of each algorithm on 72.65% cloud mask situation, as well as the RMSE of each predicted observation.
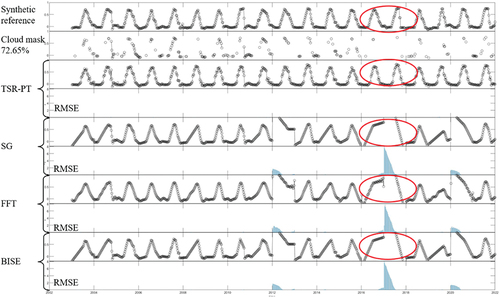
Figure 13. Comparison of the NDVI time series reconstruction result in single year on 72.65% cloud mask situation, to examine the detail performance.
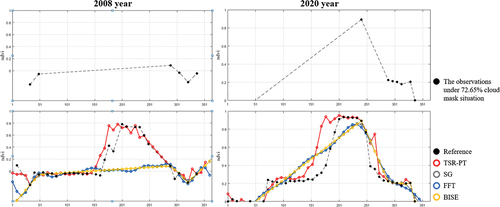
Table 1. Additional controllable variables that further help for change year determination.
Table 2. Quantitative assessment of each algorithm on Vorkuta_01 under four different cloud mask situations.
Table 3. Quantitative assessment of each algorithm on Vorkuta_02 ~ 10 under ~70% cloud mask situation.
Figure 14. The reconstructed NDVI maps in five years within July.
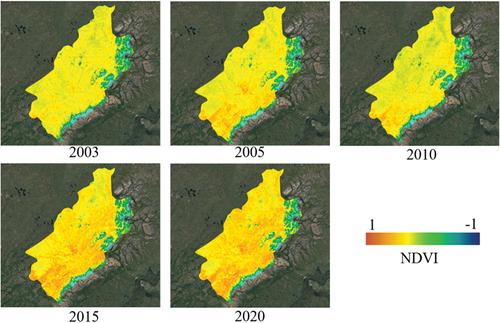
Figure 15. The reclassified maps by harden the NDVI maps with threshold.
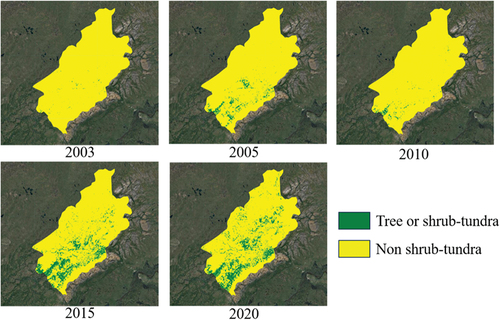
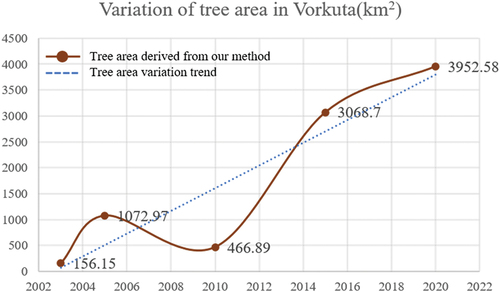
Figure 16. Variation of tree area in Vorkuta.
Data availability statement
The data that support the findings of this study are available from the corresponding author, [Da, He], upon reasonable request.