170
Views
0
CrossRef citations to date
0
Altmetric
Research Article

Enhancing outlying growth simulation in urban cellular automata via intelligent extraction-fusion of land suitability and neighborhood effects: a case study of Wuhan, China

ORCID Icon, ORCID Icon, ORCID Icon, ORCID Icon, ORCID Icon & ORCID Icon
Received 10 Sep 2023, Accepted 07 Apr 2024, Published online: 24 Apr 2024

Figures & data

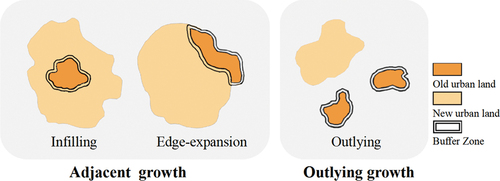
Figure 1. Three types of urban growth.

Figure 1. Three types of urban growth.

Figure 2. Illustration of NE, LS and their product.

Figure 2. Illustration of NE, LS and their product.

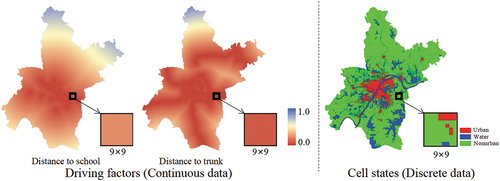
Figure 3. Differences between driving factors and cell states.

Figure 3. Differences between driving factors and cell states.

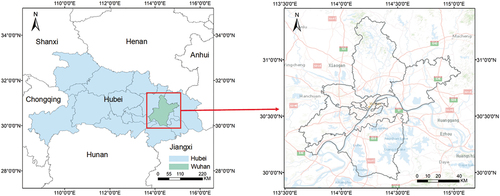
Figure 4. Location of study area.

Figure 4. Location of study area.

Table 1. List of factors in this study.

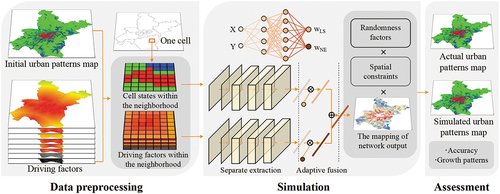
Figure 5. Procedure for modeling dynamic urban growth using the SEAF-CA model.

Figure 5. Procedure for modeling dynamic urban growth using the SEAF-CA model.

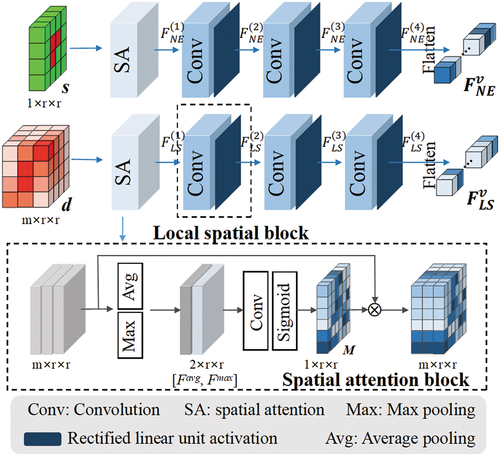
Figure 6. Illustration of separate extraction module.

Figure 6. Illustration of separate extraction module.

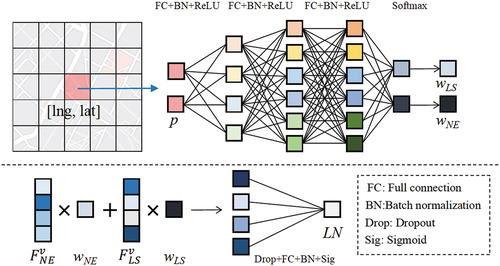
Figure 7. Illustration of adaptive fusion module.

Figure 7. Illustration of adaptive fusion module.

Table 2. Results of comparison with other models.

Figure 8. Simulation results of different models; (a) LEI distribution of new urban patches; (b) Classification results of new urban patches.
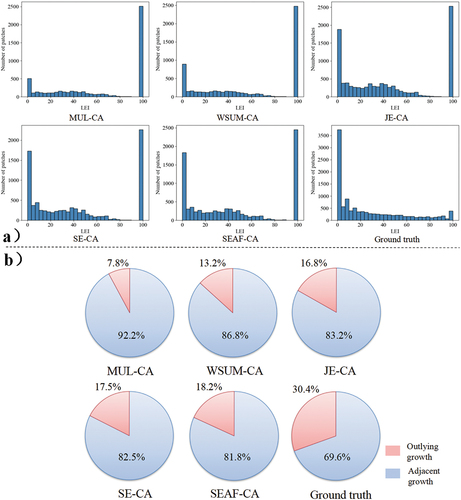
Figure 8. Simulation results of different models; (a) LEI distribution of new urban patches; (b) Classification results of new urban patches.

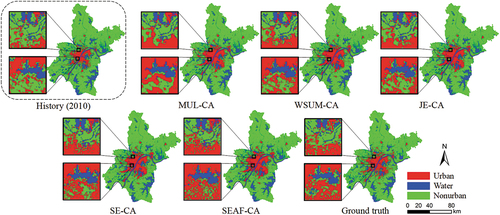
Figure 9. Detail of simulation results with different models.

Figure 9. Detail of simulation results with different models.

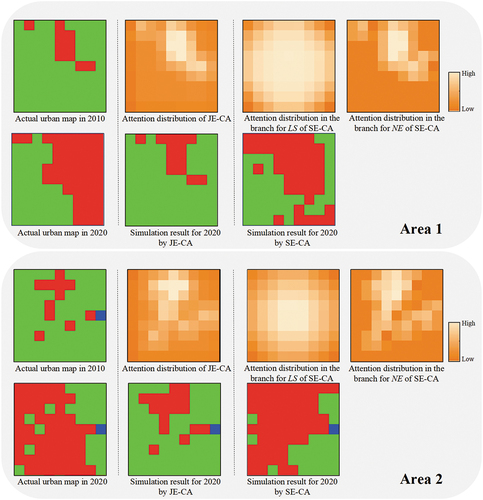
Figure 10. Detail of spatial attention distribution on the selected areas.

Figure 10. Detail of spatial attention distribution on the selected areas.

Figure 11. Analysis of the driving factors for urban growth; (a) Relative importance for each factor of JE-CA; (b) SHAP summary plot of JE-CA; (c) Relative importance for each factor of SE-CA; (d) SHAP summary plot of SE-CA.
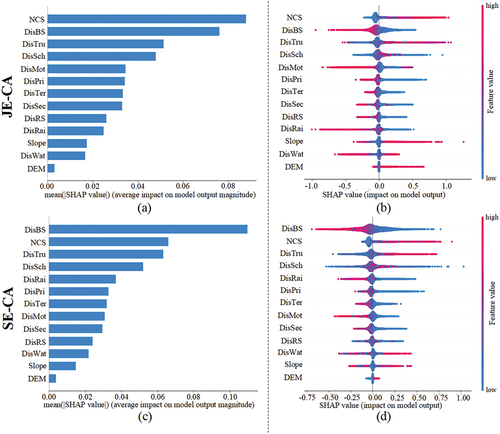
Figure 11. Analysis of the driving factors for urban growth; (a) Relative importance for each factor of JE-CA; (b) SHAP summary plot of JE-CA; (c) Relative importance for each factor of SE-CA; (d) SHAP summary plot of SE-CA.

Figure 12. Spatial distribution of the new patches belonging to the outlying growth category produced by SE-CA and SEAF-CA.
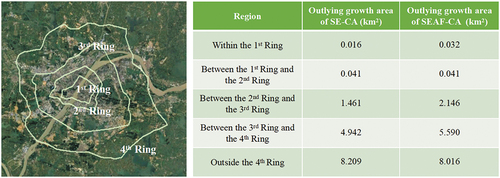
Figure 12. Spatial distribution of the new patches belonging to the outlying growth category produced by SE-CA and SEAF-CA.

Figure 13. Analysis of the adaptive fusion module; (a) Visualization of the adaptive weights; (b) Comparison of weights of each district in Wuhan.
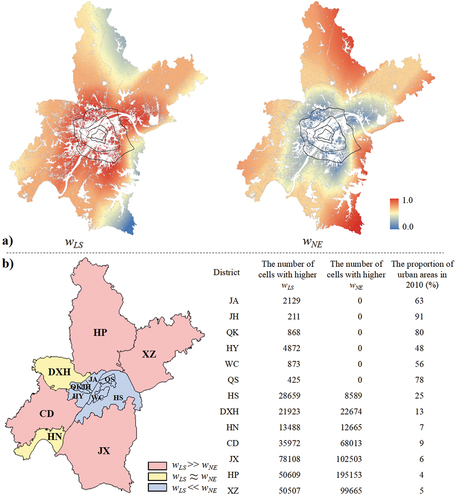
Figure 13. Analysis of the adaptive fusion module; (a) Visualization of the adaptive weights; (b) Comparison of weights of each district in Wuhan.

Table 3. Simulation results with different neighborhood size.

Table 4. Model comparison with related studies.