Figures & data
Table 1. Scoring scales for CWRF Indicators (Saikia et al. Citation2022).
Table 2. Phases of realisation.
Table 3. System contexts influencing water supply in Harare.
Table 4. System components (coloured according to their CLD representation).
Figure 1. Greater Harare Spatial Extent (COH Citation2021).
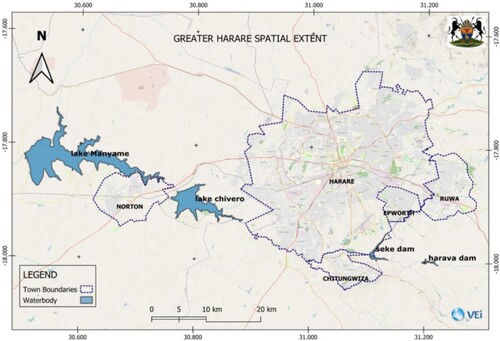
Figure 3. Key water resilience gaps in Harare.
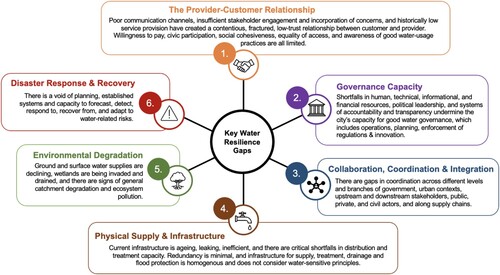
Figure 4. CLD Representing Harare’s Current Water Supply System.
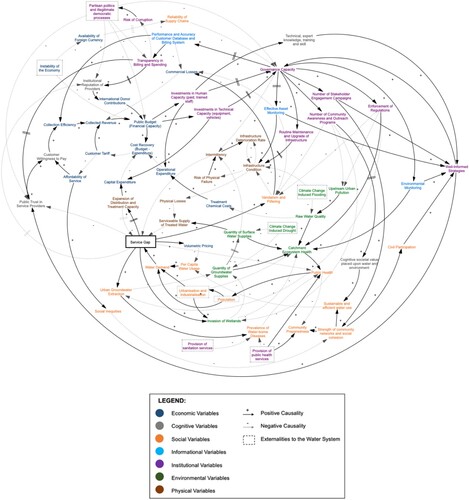
Figure 5. Subsystem focusing on Economic Factors.
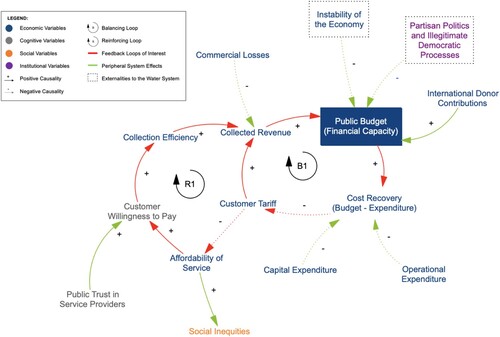
Figure 6. Subsystem focusing on Commercial Losses
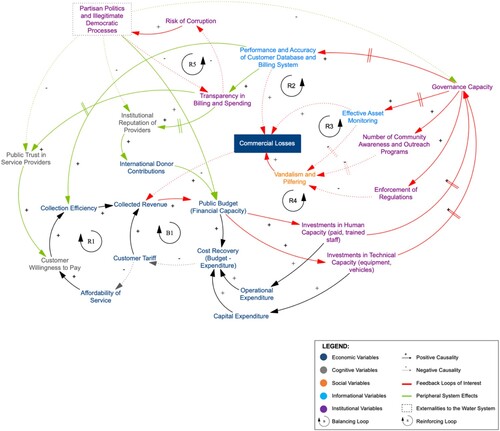
Figure 7. Subsystem focusing on Physical Infrastructure and Losses.
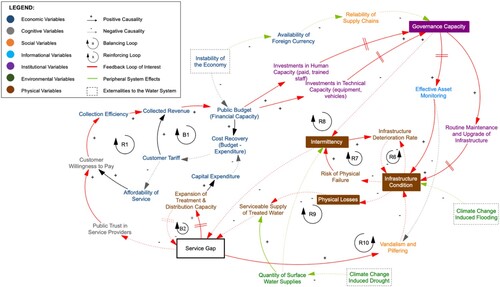
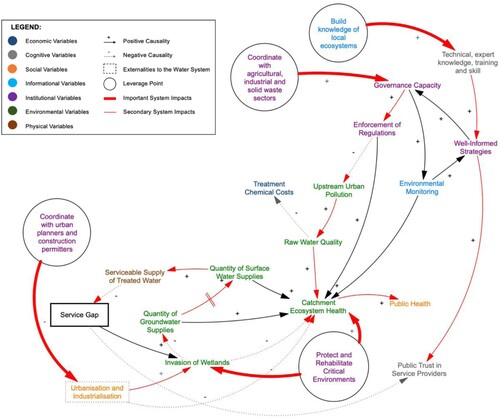
Figure 8. Subsystem focusing on Environmental Factors.
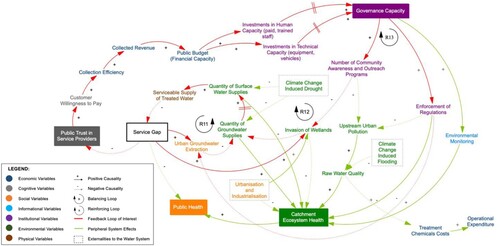
Figure 9. Subsystem focusing on Social Factors.
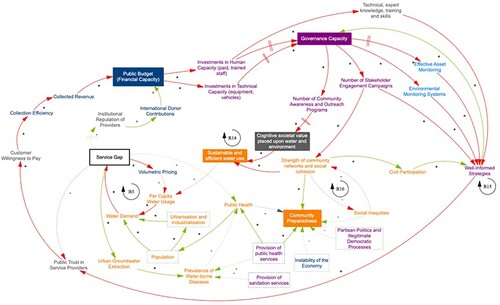
Figure 10. Summary of strategy recommendations.
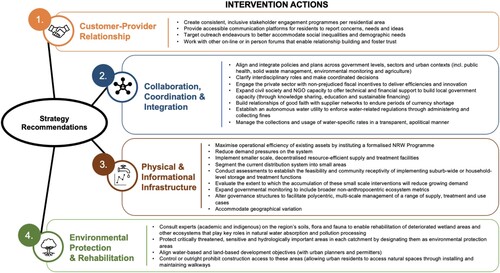
Figure 11. CLD showing System Impacts of Strategy 1: Customer-Provider Relationship.
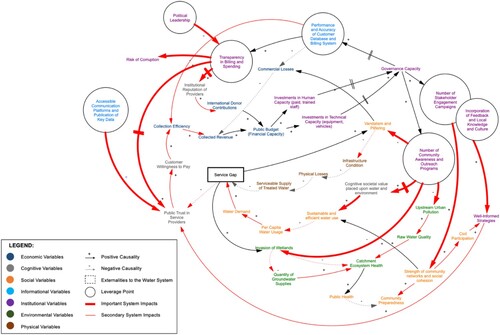
Figure 12. CLD showing system impacts of Strategy 2: Coordination, Collaboration, & Integration.
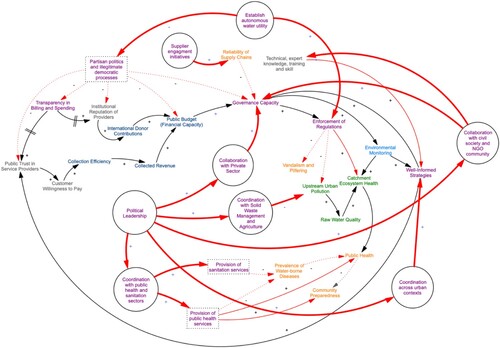
Figure 13. CLD showing system impacts of Strategy 3: Physical & Informational Infrastructure.
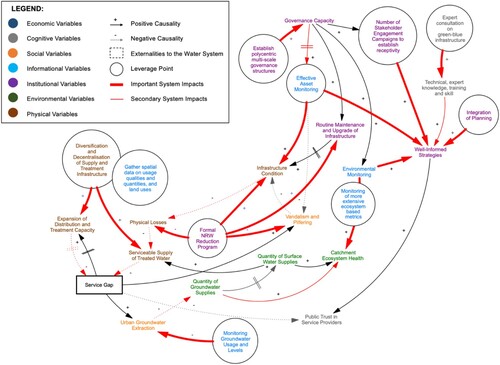
Figure 14. CLD Showing the system impacts of Strategy 4: Environmental Protection & Rehabilitation.