
Figures & data
Figure 1 . Major sources of imported water supply to Los Angeles County.
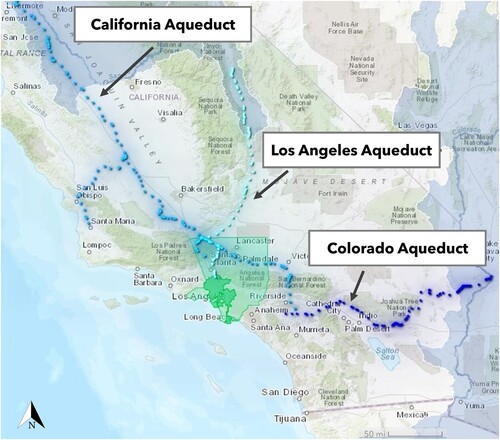
Figure 2 . Within Los Angeles, a complex system of water management includes (a) Water supply agencies, (b) Major watersheds associated with rivers, (c) Groundwater basin management areas, (d) Stormwater capture facilities.
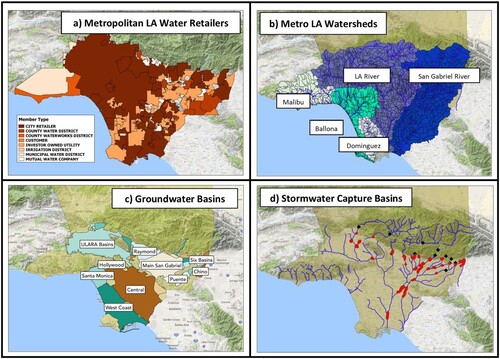
Figure 3 . Wastewater treatment facilities in metropolitan Los Angeles.
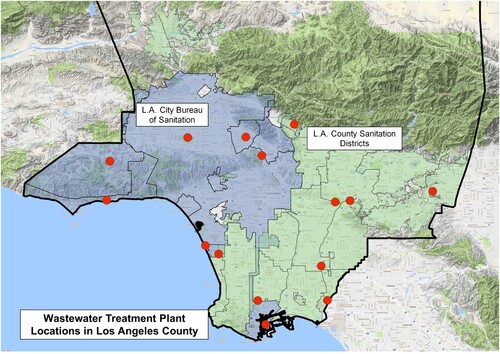
Table 1 . Operational treatment capacity parameters for current wastewater treatment and water reuse facilities, based on data from available sources. The parameters were used as constraints in the modeling (WRP = water reclamation plant).
Table 2 . Proposed new water reuse operations and associated costs added to the model for this analysis. Many operations are being flexibly designed to provide either indirect or direct potable supplies as existing and emerging regulations allow (MCM/Day = millions of cubic meters per day).
Figure 4 . Schematic depicting architecture and data flows of the Artes model
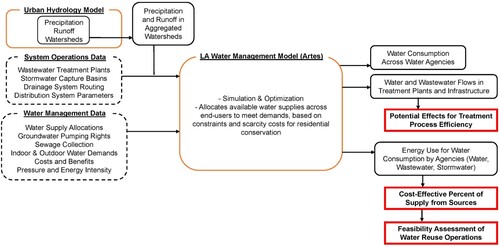
Figure 5 . Supply portfolios from the hydroeconomic modeling framework. The two scenarios modeled responses to an imposed reduction of 50% of historic imported water supplies with and without new large-scale reuse project capacity (MCM = Millions of Cubic Meters). The percentages represent the percent of total supply in the scenario from a source.
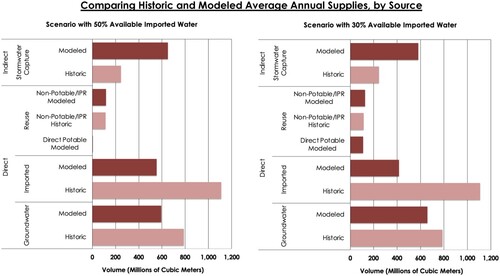
Figure 6 . Water reuse as a percentage of supply for water retailers throughout LA County in the modeled scenario with an imposed 50% reduction in available imported water.
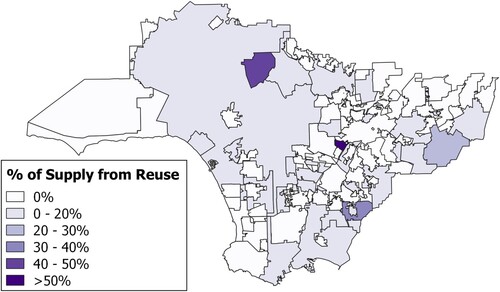
Figure 7 . Historic and modeled influent flows to the two largest wastewater treatment facilities in LA. The modeled flows are from a scenario with 30% available imported water, which represents extended water scarcity from drought.
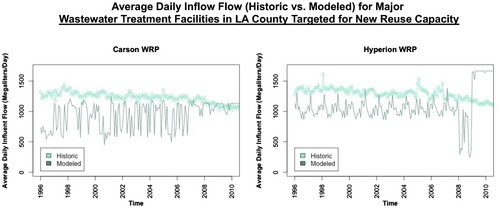
Figure 8 . Daily influent monitoring data for contaminant concentration and percent removal of Biochemical Oxygen Demand (BOD) and Total Suspended Solids (TSS) for Hyperion WRP (2011–2019). Source: Based on data from the California Integrated Water Quality System and published by Keene, Babchanik, and Porse (Citation2022).
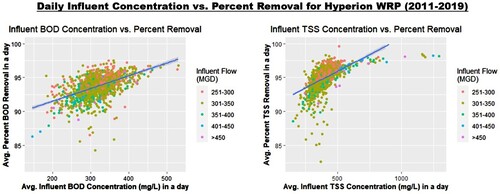
Table 3 . Results from multiple regression modeling with a semi-log formulation.
Table 4 . Modeled scenarios of imported water availability with available reuse capacity, including both existing indirect potable reuse and newly proposed advanced water treatment.
Table 5 . Average value of electricity intensity during drought, non-drought, and all years for the modeled scenario of 50% of historic imported water availability (kWh = Kilowatt-Hours). Drought and non-drought years are identified as years with greater or less than the 50th percentile of annual precipitation during the time period from 1986 to 2010.
Supplemental Material
Download Zip (4.2 MB)Data availability
Model documentation, data, and software are openly available (Porse Citation2022). Supporting data for the analysis is available as a supplementary file. Wastewater treatment facility data used to evaluate potential water quality and treatment effects is available through a Hydroshare repository (Keene, Babchanik, and Porse Citation2022).