
Figures & data
Table 1. Detailed description of selection criteria according to the PE/I/COS Framework (Brown et al. Citation2006; Huang, Lin, and Demner-Fushman Citation2006).
Table 2. A summary of extracted participant and study characteristics included in the meta-analysis in alphabetical order.
Figure 1. PRISMA Flow-Chart: Search Result.
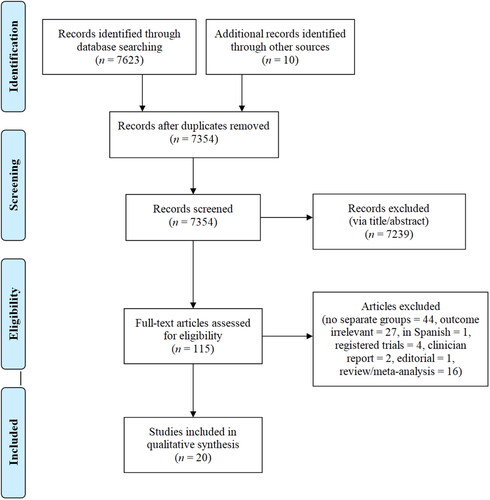
Table 3. Major limitations and the number of studies associated with each.
Figure 2. Forest plot for Hedges’s g and its associated 95% confidence interval (CI) for differences in depression between meat abstainers and meat consumers. Studies are arranged from high to low quality score.
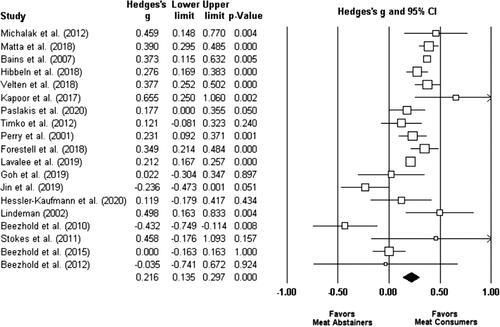
Figure 3. Funnel plot of standard error and Hedges’s g for differences in depression between meat abstainers and meat consumers.
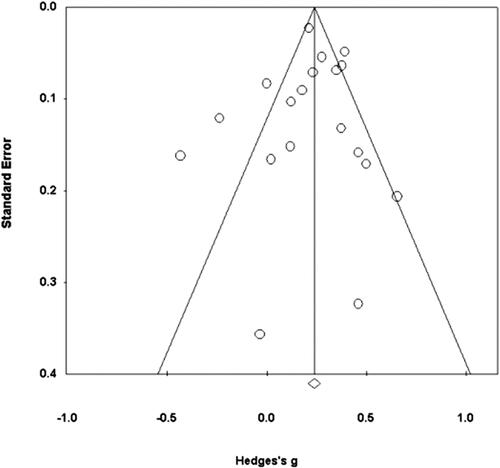
Figure 4. Forest plot for Hedges’s g and its associated 95% CI for differences in anxiety between meat abstainers and meat consumers. Studies are arranged from high to low quality score.
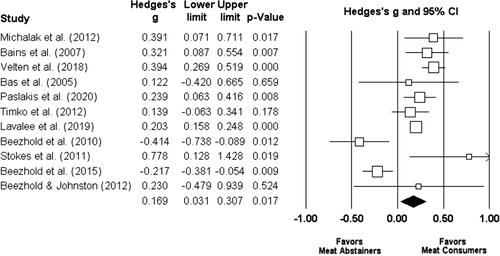
Figure 5. Funnel plot of standard error and Hedges’s g for differences in anxiety between meat abstainers and meat consumers.
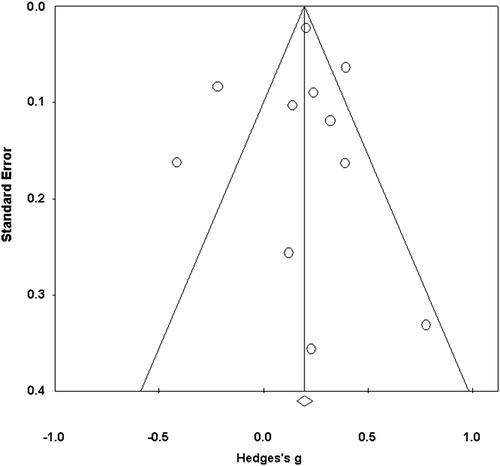
Figure 6. Bubble plot showing a regression line and prediction interval for study quality on depression between meat consumers and meat abstainers. Bubble size reflects within-study variance.
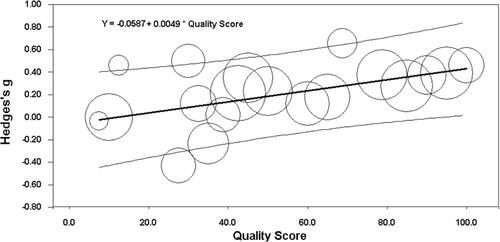
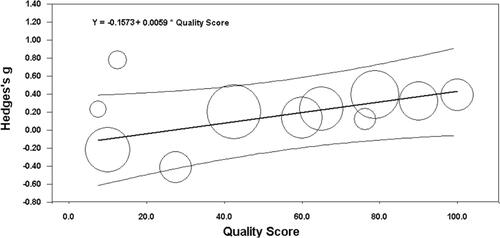
Figure 7. Bubble plot showing a regression line and prediction interval for study quality on anxiety between meat consumers and meat abstainers. Bubble size reflects within-study variance.
Supplemental Material
Download Zip (330.7 KB)Data availability
Data are available upon request.