
Figures & data
Table 1. Descriptive information regarding price (€/g) and serving size (g/bar).
Figure 1. Nutritional characterization (fat, saturated fat, total carbohydrates, sugar, fiber, and protein per 100 g) according to the type of bar.
Figure 2. Categorization of sugar, fat, and salt levels according to the nutritional traffic light system (% of products).
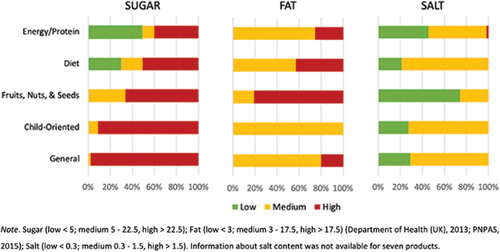
Figure 3. Example of a trial.
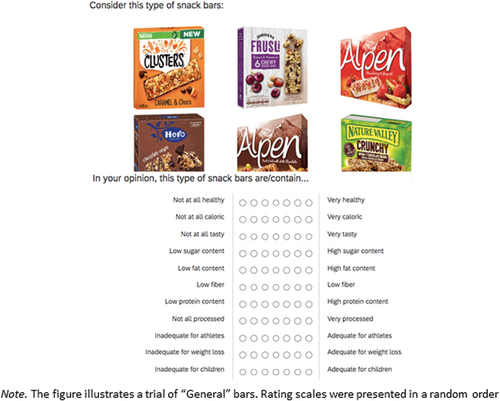
Table 2. Descriptive statistics for each evaluative dimension according to product category.
Figure 4. Nutritional content estimates.
Table A1. Descriptive statistics of nutritional characteristics (i.e., energy in Kcal; and grams of fat, saturated fat, total carbohydrates, sugar, fiber, and protein per 100 g of product) according to type of bar.
Table A2. Correlations.
Table A3. Nutritional profile, weight, and price of the products used in study 2 (M, SD).
Table A4. Impact of having (or not having) education in health-related areas on the participants’ perception of the cereal bars across evaluative dimensions.
Data availability statement
The data supporting the findings of this study are available from the corresponding author upon reasonable request.