
Figures & data
Table 1. Reason for missing child data.
Figure 1. Conceptual model of the association between parental religiosity and children’s religiosity in early childhood moderated by age, internalized parental religious motivation, active parental-child involvement, and credibility-enhancing displays. (covariates not depicted for readability; (parental variables): parental gender, socioeconomic status, parental education, nationality; (child developmental variables): communication skills, theory of mind task).
Table 2. The means (total mean), standard deviations, ranges for all numerical study variables and controls.
Table 3. Bivariate correlations and descriptive statistics of all study variables.
Table 4. Child’s age, parental internalized religious motivation, active parental-child involvement, parental credibility enhancing displays as moderators of the relationship between parental religiosity and child religiosity, and covariates.
Figure 2. Plot of Children’s age and children’s religiosity with error bars: 95% CI.
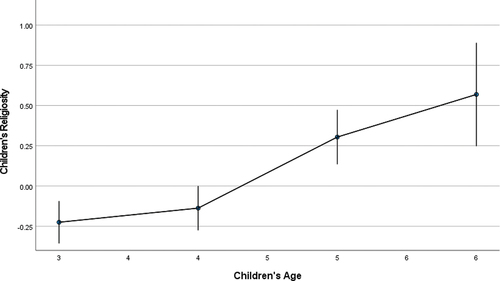
Figure 3. Plot of TOM and children’s god concept with error bars: 95% CI.
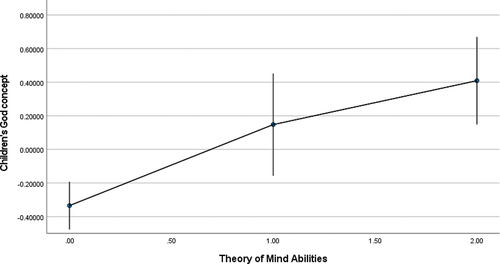
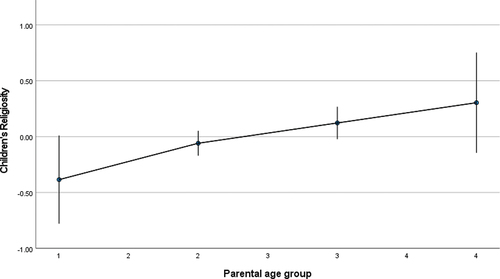
Figure 4. Plot of parental age group and children’s religiosity with error bars: 95% CI. (n of age groups).
Supplemental Material
Download Zip (64.4 KB)Data availability statement
Data that support the findings of this study will be openly available at https://osf.io/w7h3f/?view_only=f06bd9d2ab6b4617893d3e2f0a971937.