
Figures & data
Figure 1 Comparisons of estimators for sparse semiparametric regression. Metrics are aggregated over 30 synthetic datasets generated with n = 1000, p = 10,000, and g = 5000. Solid points represent averages and error bars denote (one) standard errors. Dashed lines indicate the true number of nonzero functions.
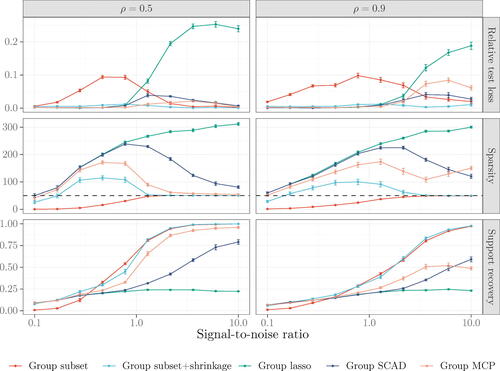
Figure 2 Comparisons of estimators for sparse semiparametric classification. Metrics are aggregated over 30 synthetic datasets generated with n = 1000, p = 10,000, and g = 5000. Solid points represent averages and error bars denote (one) standard errors. Dashed lines indicate the true number of nonzero functions.
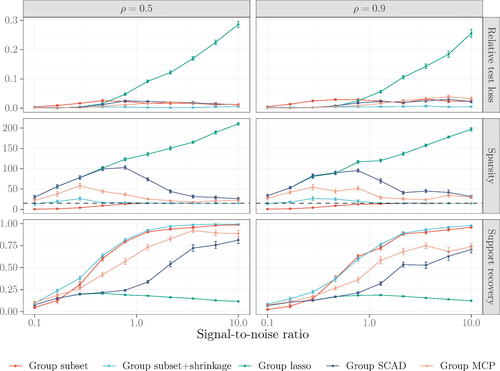
Figure 3 Comparisons of grpsel and grpreg, and their estimators. Metrics are aggregated over 30 synthetic datasets generated with ,
, and n = 1000. Vertical bars represent averages and error bars denote (one) standard errors.
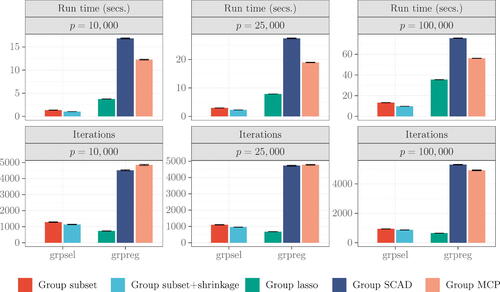
Table 1 Comparisons of methods for modeling supermarket foot traffic.
Table 2 Comparisons of methods for modeling economic recessions.
supplementary_material (2).zip
Download Zip (7 MB)Data Availability Statement
Our implementation grpsel is available on the R repository CRAN.