Figures & data
Figure 1. Empirical cumulative weight distributions at the start of treatment.
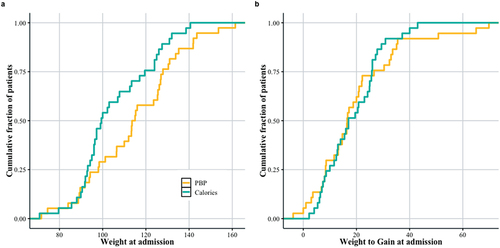
Table 1. Summary of patient demographic and outcome differences across treatment groups*.
Figure 2. Weight progress throughout treatment.
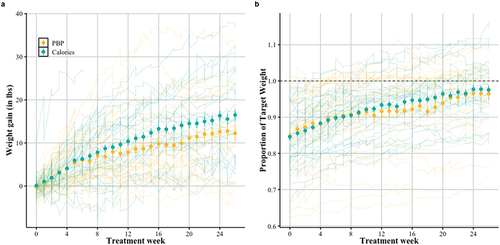
Figure 3. Eating disorder symptoms throughout treatment.
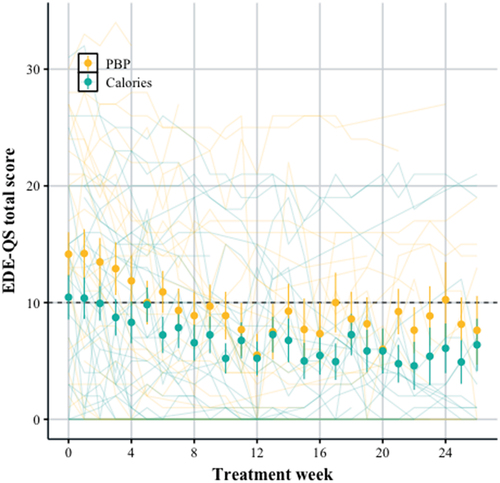
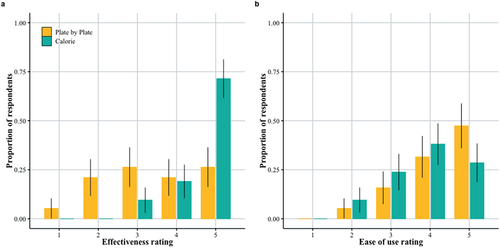
Figure 4. Caregiver ratings of their treatment group and proportion of responses by group.