
Figures & data
Figure 1. Simple DAG of a measurement model where the observed variables
and
are caused by a latent common factor C and latent unique error terms
and
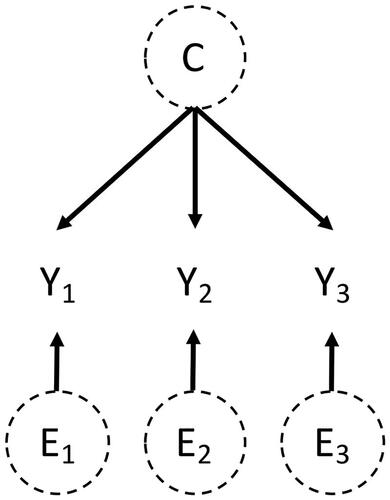
Figure 2. Simple path diagram of a measurement model. (a) LISREL style: only error variances are depicted by an arrow without a node pointing into all endogeneous variables (here: the observed variables); (b) RAM style: variances of both endogeneous and exogeneous variables are depicted by a double-headed arrow-loop (here: error variances and variances of the latent variables).
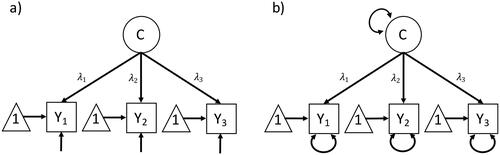
Figure 3. DAG with a selection node pointing into the observed variables. (a) Adaptation of Figure 6c in Deffner et al. (Citation2022) where only one observed variable Y is shown; (b) DAG of the complete measurement model of IB = impartial beneficence where the selection node points into potentially all observed variables (depicted by the dotted box around the observed variables).
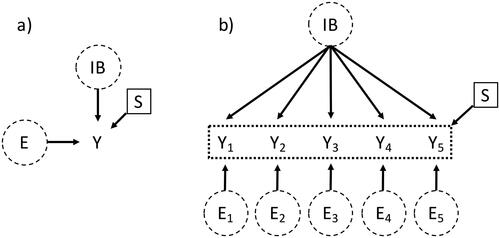
Figure 4. Pairs of measurement models of IB (impartial beneficence) for which measurement invariance does not hold between the two groups. (a) violation of configural invariance (violation of configural invariance due to different number of latent variables between groups is not displayed); (b) violation of metric invariance (assuming standardized data); (c) violation of scalar invariance; (d) violation of residual invariance (assuming unstandardized data). Parameters that differ between groups are highlighted in blue.
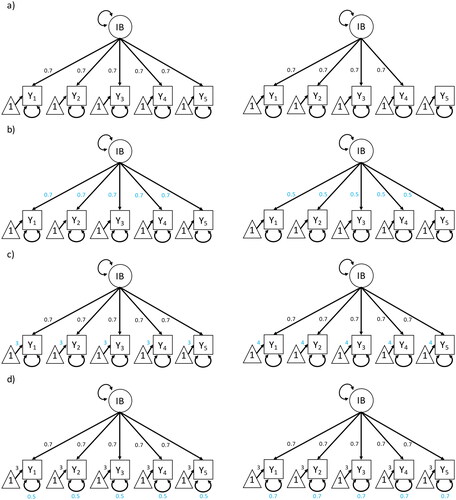
Figure 5. DAG with a selection node pointing into the observed covariate Age which influences all observed variables (depicted by the dotted box around the observed variables).
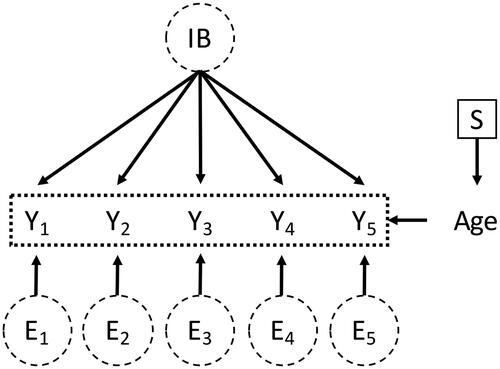
Table 1. Results of moderated non-linear factor analysis for the toy example.
Table 2. Results of -difference tests between the configural, metric, and scalar moderated non-linear factor analyses for the simulated example.
Table 3. Results of multi-group confirmatory factor analysis for the empirical example between regions Western and Eastern.
Table 4. Results of moderated non-linear factor analysis for the empirical example.
Table 5. Results of -difference tests between the configural, metric, and scalar moderated non-linear factor analyses for the empirical example.