Figures & data
Figure 1. The schematic depiction and characterization of biRGD–siRNA. (A) The diagram of biRGD–siRNA conjugate. The [cyclo(Arg-Gly-Asp-D-Phe-Lys)-Ahx]2-Glu-PEG-MAL (biRGD) peptide was conjugated to 5′-phosphate of sense strand of siRNA through thiol-maleimide linker. The backbone of siRNA strand was modified with 2′-O-methyl (2′-OMe) ribose in recommended nucleotides. (B, C) The high performance liquid chromatogram (HPLC) and mass spectrogram (MS) results of biRGD-conjugated sense stranded of VEGFR2 siRNA. (D, E) The high performance liquid chromatogram (HPLC) and mass spectrogram (MS) results of antisense stranded of VEGFR2 siRNA.
![Figure 1. The schematic depiction and characterization of biRGD–siRNA. (A) The diagram of biRGD–siRNA conjugate. The [cyclo(Arg-Gly-Asp-D-Phe-Lys)-Ahx]2-Glu-PEG-MAL (biRGD) peptide was conjugated to 5′-phosphate of sense strand of siRNA through thiol-maleimide linker. The backbone of siRNA strand was modified with 2′-O-methyl (2′-OMe) ribose in recommended nucleotides. (B, C) The high performance liquid chromatogram (HPLC) and mass spectrogram (MS) results of biRGD-conjugated sense stranded of VEGFR2 siRNA. (D, E) The high performance liquid chromatogram (HPLC) and mass spectrogram (MS) results of antisense stranded of VEGFR2 siRNA.](/cms/asset/81ec17ff-1b1e-4a64-a905-d6b44117f5b4/idrd_a_1937381_f0001_c.jpg)
Figure 2. Anti-tumor activity and mechanism of biRGD–siVEGFR2 and its combination therapy with apatinib in NSCLC subcutaneous xenografts model. Six groups of NSCLC-bearing mice were treated as follows: Saline, biRGD–siNC (2 nmol/20 g), biRGD–siVEGFR2 (1 nmol/20 g), biRGD–siVEGFR2 (2 nmol/20 g), apatinib (2.6 mg/20 g) or biRGD–siVEGFR2 (1 nmol/20 g)+apatinib (1.3 mg/20 g). biRGD–siVEGFR2 was intravenously injected every 48 hours for seven times and apatinib was given intragastrically in the same interval. (A) IVIS luminescent imaging of NSCLC-bearing mice. (B) Tumor bioluminescence intensity of each group. Luminescence from tumors was measured and quantified by the IVIS imaging system. The data were normalized to saline group. (C) The tumor growth curve. Tumor volumes were measured before each treatment. (D) The image of ex vivo tumor from each group. Three days after the last treatment, tumors were isolated from mice and photographed. (E, F) Analysis of the expression of VEGFR2 in tumor tissues. Tumor tissues were collected to detect the expression levels of VEGFR2 mRNA and protein by RT-qPCR and western blot (normalized to β-actin level), respectively. *P<0.05, **P<0.01 vs. saline group.
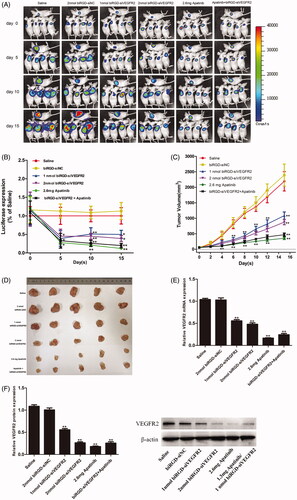
Figure 3. Anti-tumor activity of biRGD–siVEGFR2 monotherapy. Five groups of NSCLC-bearing mice were treated with saline, biRGD–siNC (5 nmol/20 g), biRGD–siVEGFR2 (5 nmol/20 g), a mixture of biRGD–siVEGFR2 (5 nmol/20 g) and gelofusine (4 mg/20 g) or apatinib (2.6 mg/20 g). biRGD–siVEGFR2 or its gelofusine mixture was injected every 48 hours for seven times and apatinib was given intragastrically in the same interval. (A) IVIS luminescent imaging of NSCLC-bearing mice. (B) Tumor bioluminescence intensity of each group. (C) The tumor growth curve. (D) The image of ex vivo tumor from each group. (E, F) Analysis of the expression of VEGFR2 in tumor tissues. Tumor tissues were collected to detect the expression levels of VEGFR2 mRNA and protein by RT-qPCR and western blot (normalized to β-actin level), respectively. *P<0.05, **P<0.01 vs. saline group.
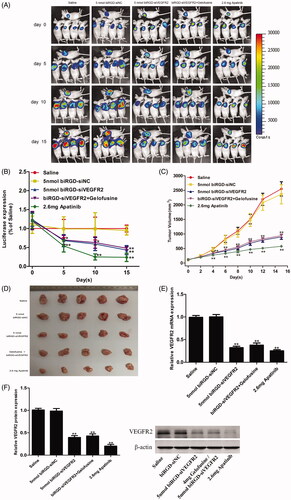
Figure 4. The effect of biRGD–siVEGFR2 on angiogenesis and tumor proliferation. (A) Immunohistochemical staining with CD31 was used to detect neovascularization in tumor tissues at ×400 original magnification (indicated by arrows). (B) Immunohistochemical staining with ki67 was used to detect cell proliferation in tumor tissues at ×400 original magnification (indicated by arrows). Positive cells were brown. Bar = 20 μm.
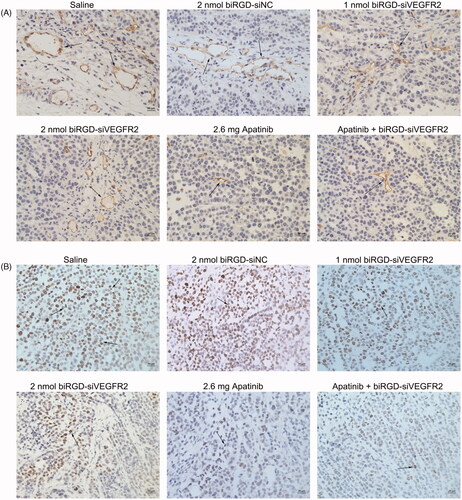
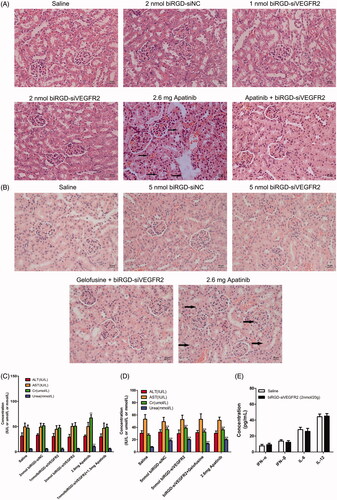
Figure 5. Toxicity and immunogenicity assessment of biRGD–siVEGFR2 in vivo. (A, B) Analysis of H&E stained sections of kidneys from in vivo anti-tumor assays. Black arrows indicate interstitial hyperemia. (C, D) Serum biochemical indicators from in vivo anti-tumor assays were used to assess potential liver and kidney toxicity. Three days after the last administration, blood serum was measured for AST, ALT, Cr and BUN in each group. (E) Analysis of IL-6, IL-12, IFN-β and IFN-α levels in the serum from C57BL/6J mice at six hours after the single injection of saline or biRGD–siVEGFR2 (2 nmol/20 g). **P<0.01, versus saline group, n = 5; bar = 20 μm.