Figures & data
Figure 1. SEM images (A) and water contact angles (B) of PEEK, SPEEK, SPEEK–pDA, and SPEEK–pDA–GS. (C) FTIR spectra of pDA, GS + pDA, and GS. Inset of (A) presents the EDS spectra of the obtained SEM imaging area of the corresponding samples. (n = 3, * p < .05, ** p < .01, and*** p < .001).
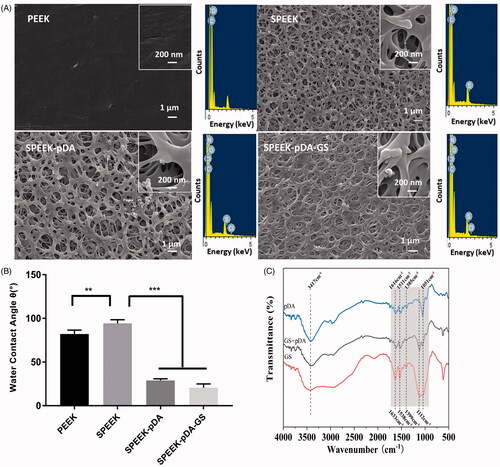
Figure 2. Images (A) and the number of the bacterial colonies (B) of S. aureus added, isolated, and cultured on agar for consecutive days with the co-culture of natural PEEK, SPEEK, and SPEEK–pDA–GS. (n = 3, *** p < .001).
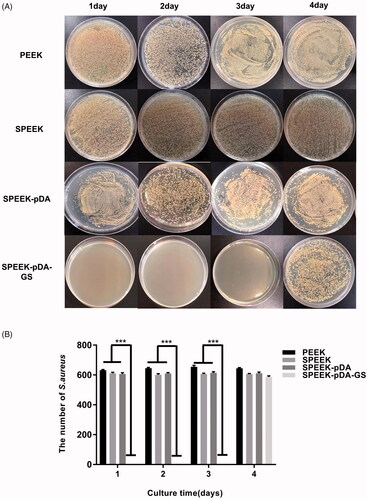
Figure 3. Effects of PEEK, SPEEK, SPEEK–pDA, and SPEEK–pDA–GS on the osteogenic differentiation of MC3T3-E1 under osteoinductive and osteoconductive conditions. (A) ARS staining for the morphology evaluation of the calcium deposition and (B) calcium deposition results on days 14 and 21. (C) Determination of ALP activity on days 3 and 7. (n = 3, * p < .05, ** p < .01, and *** p < .001).
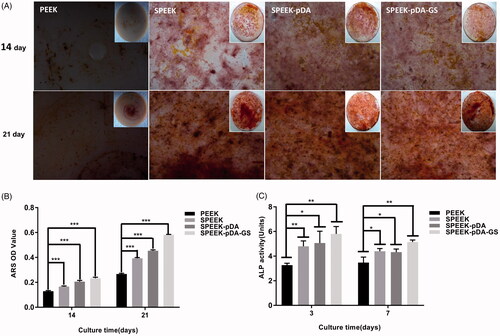
Figure 4. (A) SEM images of MC3T3-E1 and RAW264.7 cells after being cultured on different samples for 24 h at low and high magnifications. OD value, proliferation ability, and cell viability of MC3T3-E1 (B) and RAW264.7 (C) cells in different groups on days 1–7 detected using the CCK-8 assay. The value of 1 in the Y-axis of the third column of (B) and (C) is the cell viability in plate without any sample interference. (n = 3, * p < .05, ** p < .01, and *** p < .001).
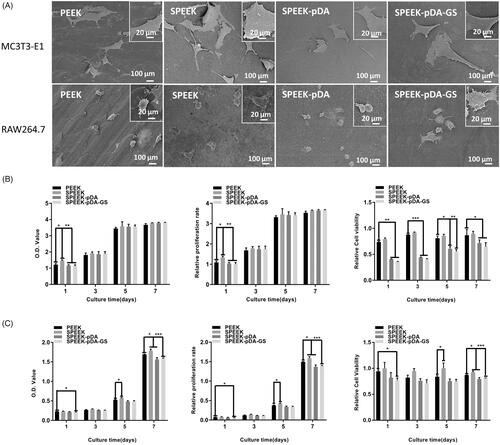
Figure 5. (A, C) Representative images of surface markers (CCR7 and CD206) of RAW264.7 analyzed using flow cytometry, and (B, D) the percentages of CCR7- or CD206-positive cells on PEEK, SPEEK, SPEEK–pDA, and SPEEK–pDA–GS, respectively. (n = 3, * p < .05, ** p < .01, and *** p < .001).
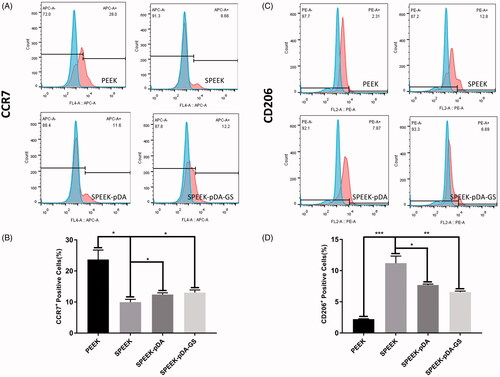
Figure 6. (A) Schematic illustration of the in vivo process of the implant for the uninfected (-) or infected (+) rat. (B) X-ray images of rats of PEEK (-), SPEEK (-), SPEEK (-), and SPEEK–pDA–GS (+) groups at 0, 2, and 4 weeks after surgery. The blue arrow indicates the implantation site.
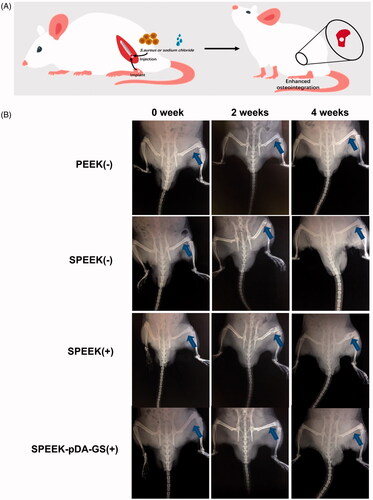
Figure 7. IHC staining for anti-inflammatory (IL-4 and IL-10) and proinflammatory (IL-6 and TNF-α) proteins and surface markers (CCR7 and CD206) of macrophage cells from the in vivo experiments of the PEEK (-), SPEEK (-), SPEEK (+), and SPEEK–pDA–GS (+) groups.
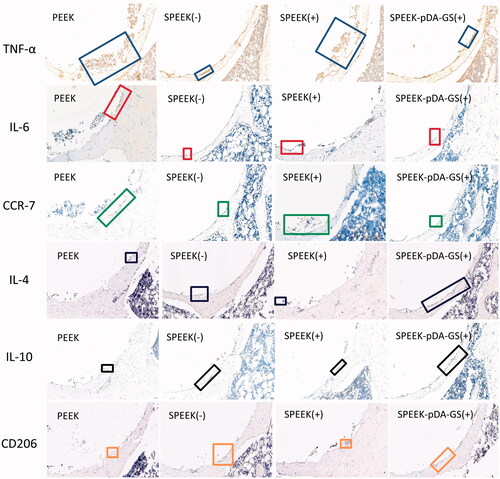
Figure 8. (A) Horizontal axis image of the implant. Blue arrows show the new bone around the implant, and white arrows show the trabeculae. (B) Vertical axis image of the implant. White arrows show where the new bone is attached to the implant. (C) 3 D reconstruction images of different samples of bone implants. The white arrow indicates the interface where the implant connects to the surrounding bone. (D) Quantitative analysis of (a) BV/TV and (b) Tb.N after implantation for six weeks with different modified PEEK samples. The implantation rats were PEEK (-), SPEEK (-), SPEEK (+), and SPEEK–pDA–GS (+) groups, respectively. (n = 3, * p < .05, ** p < .01, and *** p < .001).
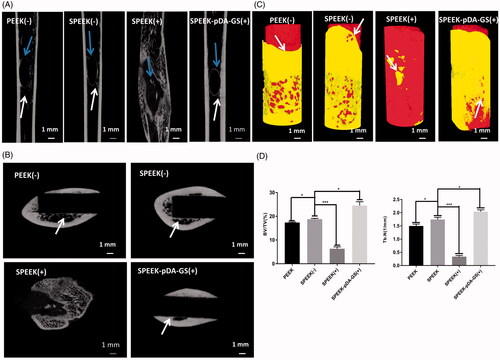
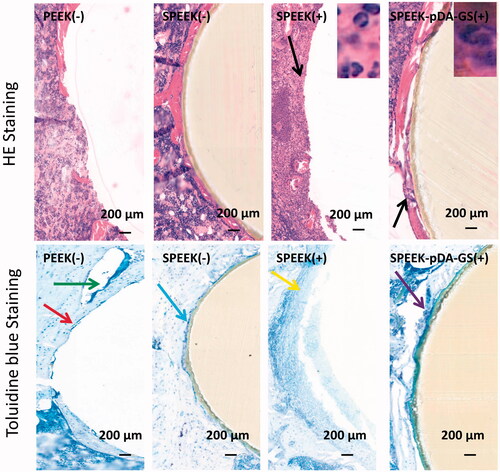
Figure 9. Histological analysis of the in vivo bone integration using HE and toluidine blue staining methods in PEEK (-), SPEEK (-), SPEEK (+), and SPEEK–pDA–GS (+) groups, respectively.