
Figures & data
Figure 1. Ultrasound images of the quadriceps muscle.
Figure 2. Flow diagram of participants.
Table 1. Participant characteristics.
Figure 3. One-way analysis of variance for QMT.
Multiple comparison : *p < 0.05 (normal vs. sarcopenia and sarcopenic obesity; simple obesity vs. sarcopenia and sarcopenic obesity).
QMT, quadriceps muscle thickness.
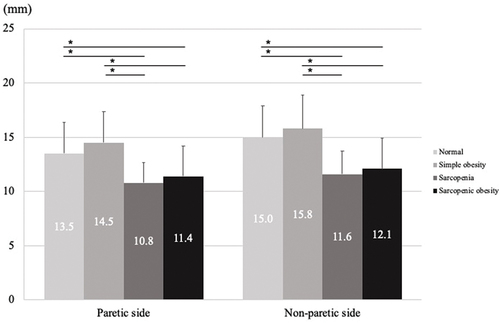
Figure 4. One-way analysis of variance for QEI.
Multiple comparison:*p < 0.05 (normal vs. simple obesity and sarcopenic obesity; sarcopenia vs. simple obesity and sarcopenic obesity).
QEI, quadriceps muscle echo intensity.
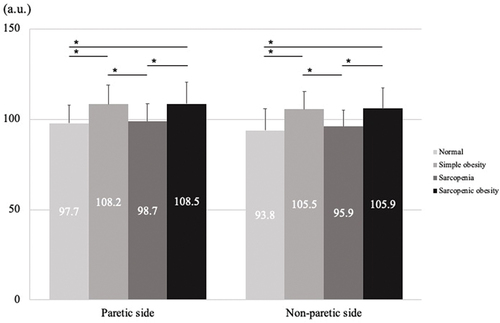
Table 2. Multiple regression analysis for QMT.
Table 3. Multiple regression analysis for QEI.
Data availability statement
The data that support the findings of this study are available from the corresponding author upon reasonable request.