491
Views
0
CrossRef citations to date
0
Altmetric
Research Article

Predicting Reading Fluency Growth from Grade 2 to Age 23 with Parental and Child Factors

ORCID Icon, ORCID Icon, ORCID Icon, ORCID Icon & ORCID Icon

Figures & data

Figure 1. a) the specification of the main growth curve models 1–5 for reading fluency and the predictors: b) the specification of the additional models 1–5 with two separate growth curves.
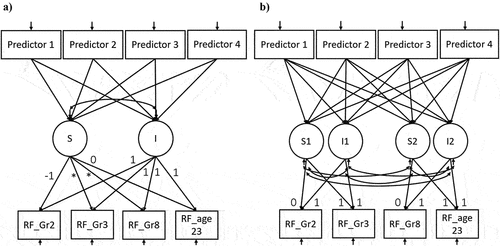
Note. Models 1, 2, 3, 4, and 5 were very similar and only differed on their predictors. The exact list of predictors included in each of the four models can be found in . Asterisks (*) indicate that the loadings were allowed to be estimated freely.
Figure 1. a) the specification of the main growth curve models 1–5 for reading fluency and the predictors: b) the specification of the additional models 1–5 with two separate growth curves.

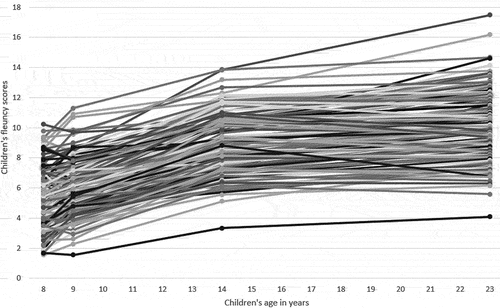
Figure 2. All reading fluency trajectories.

Figure 2. All reading fluency trajectories.

Table 1. Descriptive statistics for all variables.

Table 2. Pearson correlation coefficients between all variables.

Figure 3. The associations between significant predictors and the reading fluency trajectory.
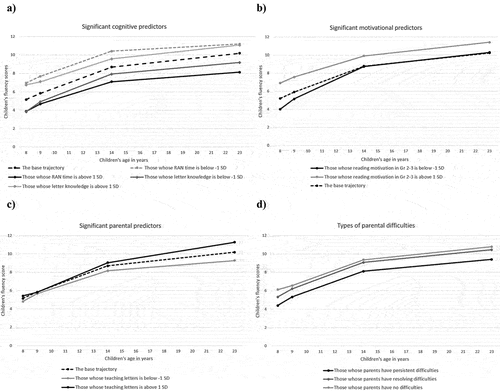
Note. In Figures a-c, the base trajectory was constructed using the mean scores of reading fluency derived from the whole sample. The other trajectories were constructed using the mean scores of reading fluency derived from the subsamples of those who demonstrated a) RAN, b) letter knowledge, c) reading motivation above or below one standard deviation in the total sample, or d) those who received the amount of literacy-related teaching that was above or below one standard deviation in the total sample.
Figure 3. The associations between significant predictors and the reading fluency trajectory.

Table 3. The fully standardized estimates of the models and the model fit statistics.

Table A1. Patterns of missingness in the predictor variables with largest missingness (>20%).

Table A2. Patterns of missingness in reading fluency at age 23.

Table A3. The fully standardized estimates of the additional models that included two growth specifications.

Supplemental material

Appendix - Growth curve article.docx

Download MS Word (27.7 KB)