Figures & data
Table 1. Means and standard deviations at pretest and posttest.
Table 2. Correlations at pretest (above diagonal) and posttest (below diagonal) between outcome variables.
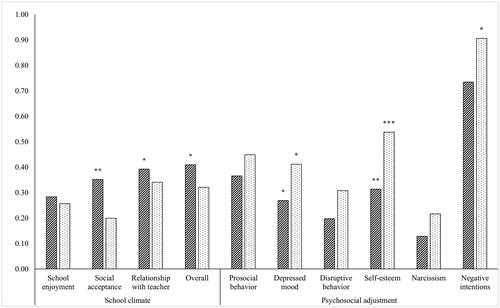
Figure 2. Effect sizes (Cohen’s d) for pretest-posttest changes in the experimental groups. Note. Universal implementation condition indicated with striped bars; indicated implementation condition indicated with dotted bars. Asterisks indicate significant differences between the experimental group and the control group.

Table 3. Changes in the universal intervention condition and the indicated intervention condition compared to the control condition and each other.
Supplemental Material
Download MS Word (25 KB)Data availability statement
The data that support the findings of this study are available from the corresponding author, BM, upon reasonable request.

