Figures & data
Figure 1. Reynolds temperature ∆T curve of mung beans.
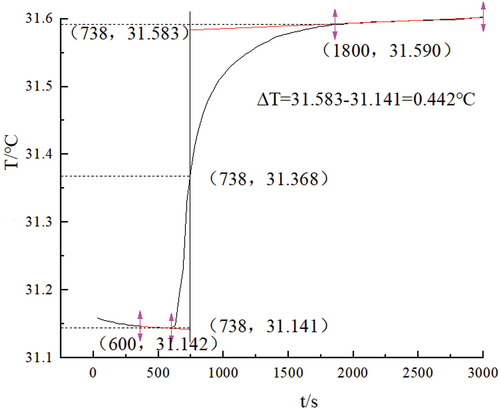
Table 1. Combustion heat values of five types of beans (n = 3).
Figure 2. TG and DTG curves for mung beans.
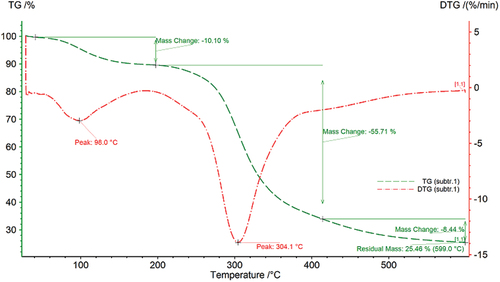
Figure 3. Curves for the differential thermal analysis of mung beans.
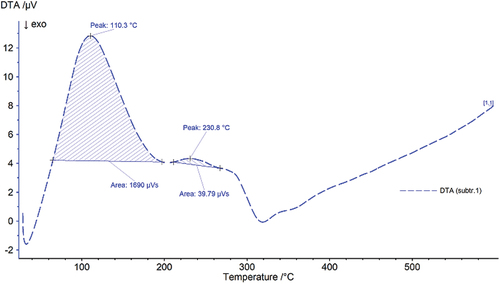
Table 2. Data from mung bean TG-DTG.
Figure 4. TG and DTG curves for soybeans.
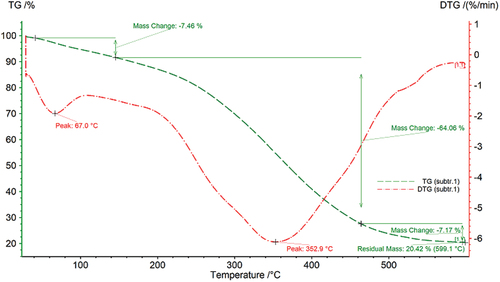
Figure 5. Soybean differential thermal analysis curves.
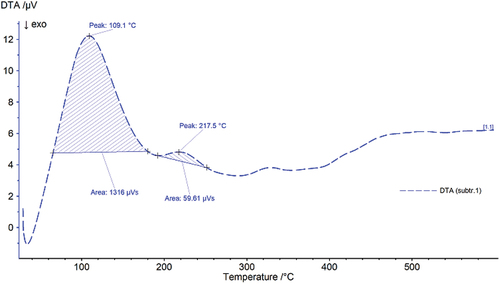
Table 3. Data on soybean TG-DTG.
Figure 6. TG and DTG curves for black beans.
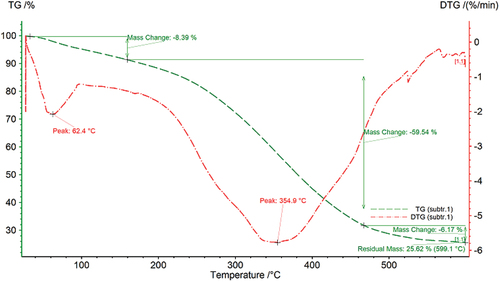
Figure 7. Differential thermal analysis curves of black bean.
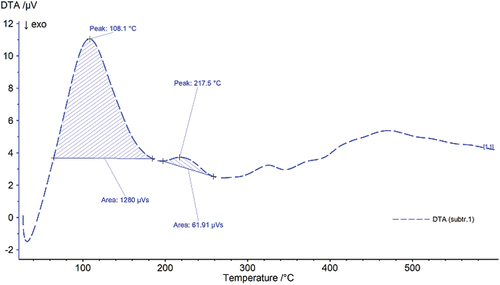
Table 4. Data on black beans from TG-DTG.
Figure 8. TG and DTG curves for red bean.
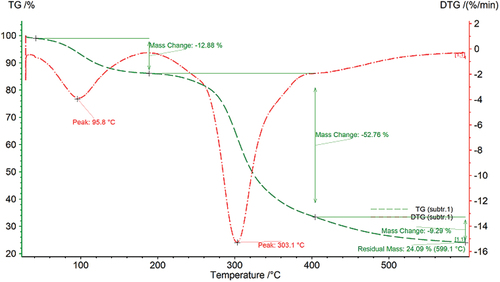
Figure 9. Red bean differential thermal analysis curves.
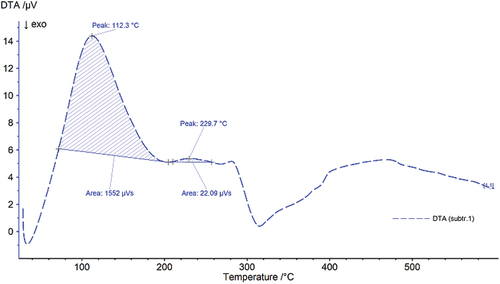
Table 5. Red bean TG-DTG data.
Figure 10. TG and DTG curves of the adzuki beans.
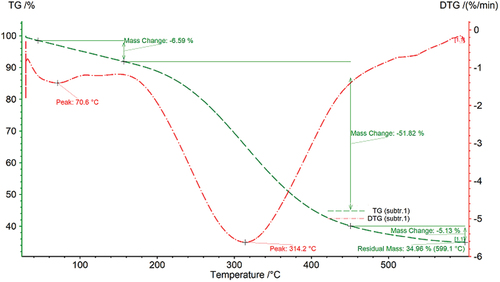
Figure 11. Differential thermal analysis curves for the adzuki beans.
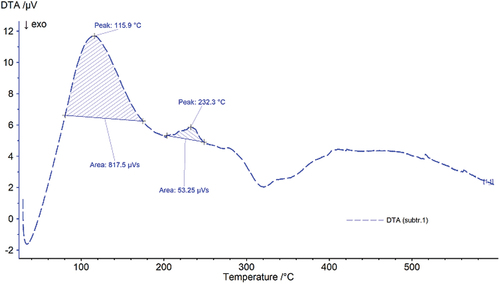
Table 6. TG-DTG data from the adzuki beans.
Table 7. Fat, crude fiber, and ash contents of 5 kinds of beans (n = 3, CV%<2.0%).
Table 8. Data for 18 trace elements from five different types of beans (μg/g, n = 6, RSD < 2.0%).
Table 9. Fifteen trace element contribution rates to variance and factor characteristic roots in five types of beans.
Table 10. The rotated factor loading matrix of 15 trace elements in five types of beans.
Table 11. Factor scores of 15 trace elements for 5 types of beans.
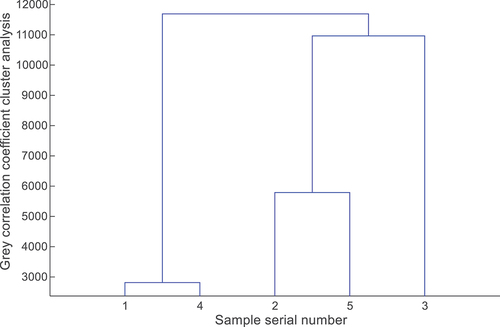
Figure 12. Gray correlation coefficient cluster analysis tree diagram of 5 kinds of beans.