
Figures & data
Table 1. The formulae and ingredients used to produce yogurt ice cream (% w/w).
Table 2. Physicochemical properties of YIC prepared with different prebiotics and fat contents.
Figure 1. tan of yogurt ice cream mix at different frequencies.
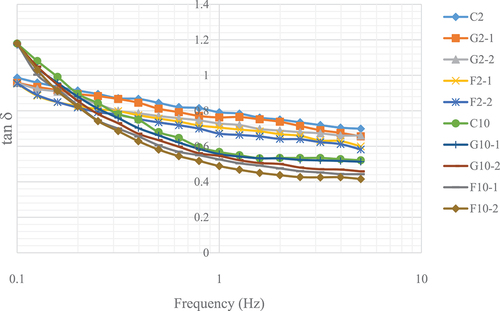
Figure 2. Hardness of yogurt ice cream with different fat content and different type and concentration of prebiotics.
Figure 3. Melting curve of yogurt ice cream with different fat contents and prebiotics.
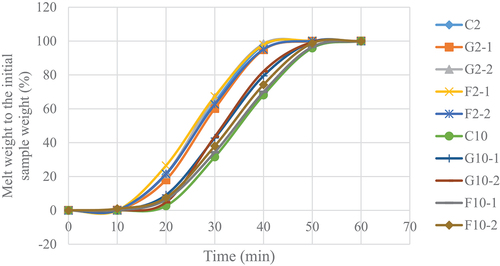
Figure 4. Microstructures of yogurt ice cream with different fat contents and prebiotics.
Figure 5. Viable count of Bifidobacterium longum TISTR 2195 in yogurt ice cream with different fat contents and prebiotics during storage for 6 months.
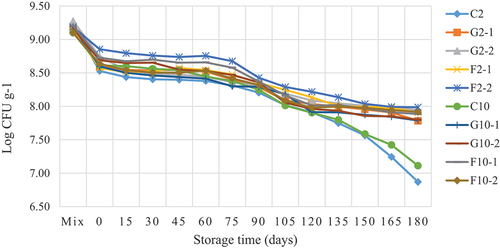
Figure 6. Means and standard deviations for the percentage survival of B. longum TISTR 2195 in yogurt ice cream with different fat content and prebiotics using an in vitro gastrointestinal system at different time points.
Data availability statement
The relevant data have been provided in the form of tables and figures. However, any further information required will be provided by the authors on reasonable request.